Safety in numbers in Australia
Robinson DL
A paper with similar material was published in the Health Promotion Journal of Australia (Robinson, 2005b)
The idea of ‘Safety in Numbers’ has been known for years. Hudson, 1978 wrote in 1978: "the fact that cyclists’ rights are more respected in towns where cycling is prevalent suggests than an increase in the number of cyclists on all roads would condition car drivers to expect and allow for them."
Safety in numbers for motorists
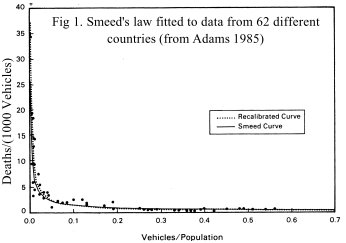
For motor vehicles, research into Safety in Numbers was published in 1949. Smeed, 1949 showed the risk per vehicle is lower in countries where more people drive. Fig 1 demonstrates this for 62 different countries. The risk per vehicle (represented by the number of deaths per vehicle (D/V)), is very closely related to the amount of driving (represented here by the number of vehicles per person (V/P)). The curve is a remarkably good fit, suggesting some important underlying principle of road safety may be involved.
|
 |
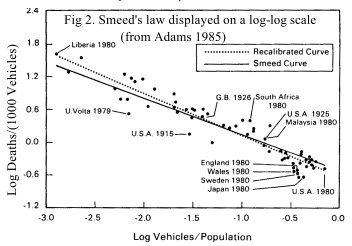 |
In 1985, John Adams reviewed Smeed's work and marvelled at how well predictions from 1938 data (when the highest V/P was 0.23) fitted data with V/P of more than 0.5 vehicles per person (Fig 2, drawn on a log-log scale). Adams argued that to represent real advances in road safety, measures must be shown to provide benefits over and above what would be predicted by Smeed's law.(Adams 1985)
|
Australian data
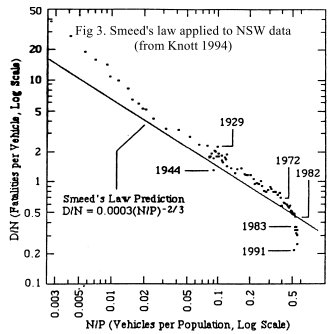
Australian researcher Dr JW Knott applied Smeed's law to 110 years of NSW road fatality data and came to similar conclusions (Knott 1994). Speed limits (introduced and abolished at various times), random breath testing (introduced in December 1982) and increased public awareness of road safety issues in 1990-91 were among the few measures to stand out as real improvements above what would be expected from changes in vehicle numbers (Fig 3).
|
 |
 |
Safety in numbers for cyclists
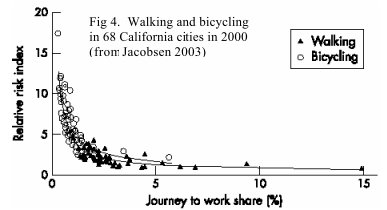
So what about bikes? Is the risk per cyclist also related to the amount of cycling? Peter Jacobsen's research (Jacobsen, 2003), the Injury Prevention Editor's Choice for Volume 9, Issue 3, shows the answer is a resounding 'yes!' Fig 4 compares the risks per cyclist and pedestrian with the proportion cycling and walking to work in 68 Californian cities. Risks per cyclist (pedestrian) were estimated by dividing the total number of reported injuries by the number of people cycling (walking) to work (used as a proxy for the total amount of cycling/walking). A strong relationship (remarkably similar to Smeed's law for motor vehicles) is evident. Risks per cyclist or pedestrian are substantially lower in cit ies where a higher proportion of the population cycles or walks to work.
|
|
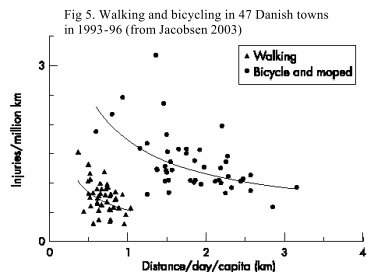
Safety in Numbers is not confined to the US. Cycling in Denmark is generally popular and very safe; fatalities per million km cycled are about a third of the UK rate. Yet when distances cycled are plotted against the injury rate per million km, as in the US, cities where people cycle more have lower injury rates per unit distance (Fig 5).
|
 |
 |
Across-country comparisons
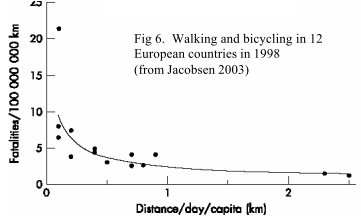
The same relationships were also found to hold for across-country comparisons. Fig 6 compares fatality rates per 100 million km with average distance cycled in 12 European countries. The rule holds up well; cycling is much safer in countries where lots of people cycle.
|
Changes over time
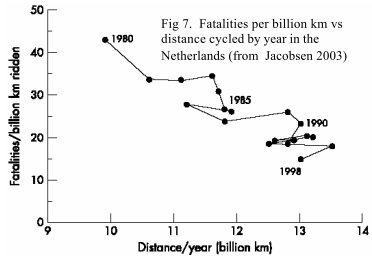
Does this mean that cycling will become safer in a particular country, if more people are encouraged to cycle? The answer, again, seems to be yes! Fig 7 shows that fatalities per billion km fell by over 60% from 1980-98 in the Netherlands as cycling became more popular.
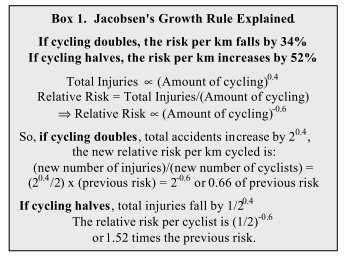
Jacobsen concluded: "Multiple independent data sets show that the total number of pedestrians or bicyclists struck by motorists varies with the 0.4 power of the amount of walking or bicycling (respectively). This relationship is consistent across geographic areas from specific intersections to cities and countries."
This implies that, over a wide range of circumstances, if the amount of cycling doubles, the risk per cyclist is likely to fall by about 34%. Conversely, if cycling halves, the risk per cyclist is likely to increase by a staggering 52% (See Box 1). This is a rule that should be taken seriously and used by everyone involved in bicycle planning and road safety issues. Any measures that discourage cycling by 30-40% (such as helmet laws in Australia) are likely to produce real and significant increases in the risk of injury per cyclist.
|
 |
 |
 |
Australian Data (1980s)
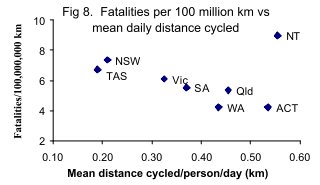
The Growth Rule fits Australian data well. Fig 8 compares fatality rates per 100 million km with average daily distance cycled for all Australian States. The data are based on estimated distances cycled in 1985-86 (FORS, 1988) and cyclist deaths for the 6 years 1983-88. Average distances cycled per person per day in WA (0.44 km) were slightly more than double those in NSW (0.21 km). WA had 4.2 deaths/10 8 km, 42% lower than NSW (7.4 deaths/10 8 km). Compared with NSW, the average improvement in safety for WA and Qld combined – 35% – is almost exactly as predicted by the Growth Rule.
Note that smaller jurisdictions such as the NT, included in Fig 8 for completeness, are too variable to be meaningful. Fig 8 was based on 1983-88 data, with 11 cyclist deaths in the NT (population about 160,000). However, other 6-year periods (e.g. 1980-82 & 1989-91) had less than half that number.
|
Australian Data: changes over time in WA
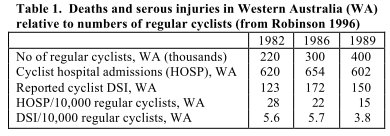
The Growth Rule also explains changes over time in Western Australia (WA). Numbers of regular cyclists (those who cycle at least once a week) almost doubled from 1982 to 1989. Table 1 shows that cycling became safer. Numbers of cyclists admitted to hospital (HOSP) and reported deaths and serious injuries (DSI) per 10,000 regular cyclists fell by 46% and 32% respectively. Jacobsen's Growth Rule, predicting a 34% fall in injuries per cyclist is pretty close to what happened in reality.
|
 |
 |
Injury rates following helmet laws in 1990s
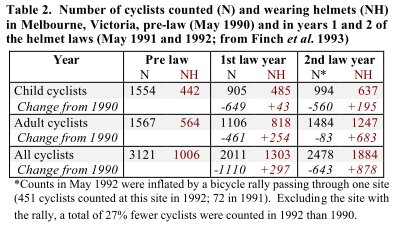
In contrast to the increases of the 1980s, cycling decreased with the helmet laws of the 1990s. In Melbourne, Victoria, identical surveys at the same time of year, in similar weather, at the same 64 sites and observation periods (Finch, Heiman and Neiger, 1993) counted 36% fewer cyclists in 1990 (29% fewer adults and 42% fewer children) and 27% fewer in 1991. Increases in numbers wearing helmets were generally less than decreases in numbers counted (Table 2). This suggests that non-helmeted cyclists, especially children, were more likely to be discouraged from cycling than encouraged to wear helmets.
|
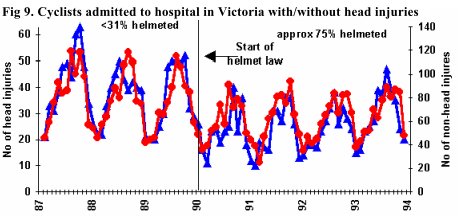
Numbers of cyclists admitted to hospital with both head and other injuries fell markedly with the law (Fig 9) (Carr, Dyte and Cameron, 1995). If head injuries fell by more than non-head injuries, we might conclude that the increased helmet use helped prevent serious head injury. However, Fig 9 shows that head and non-head injuries followed almost identical trends before and after the law. This suggests the fall in head injuries was mainly because there were fewer people riding (as shown by the surveys) and fewer serious crashes, rather than because helmets prevented serious injury when crashes occurred.
 Victoria launched an intensive road safety campaign to discourage speeding and drink-driving at almost the same time as the helmet law. Pedestrian fatalities fell by 42% (from 159 in 1989 to 93 in 1990). This campaign, estimated to have reduced accident costs by £100M for an outlay of £2.5M, (Powles and Gifford, 1993) will also have benefitted cyclists. Thus the fall in hospital admis sions appears to be due to 1) the road safety campaign, and 2) less cycling after the helmet law.
So what about "Safety in Numbers"? Did cyclists have higher injury rates after the law, due to the fall in the level of cycling? It is well known that pedestrian and cyclist injuries follow almost identical trends. By comparing pedestrian and cyclist safety before and after the law, it is possible to evaluate whether cyclists gained or lost from the law. In the two years before the law, deaths and serious head injuries (DSHI) represented 26.5% of all serious injuries (ASI) to cyclists in bike/motor vehicle collisions. This fell by 1.7 percentage points to 24.8% in the 2 years after the law (Table 3). For pedestrians, the fall over the same period was actually greater – 2.5 percentage points. Helmets are popularly believed to prevent death and serious head injury, yet the fall in %DSHI for pedestrians was actually greater than that achieved for cyclists with the helmet law.
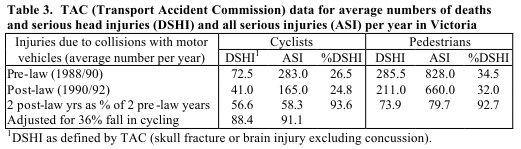 Estimates of injury rate per cyclist also suggest that "Safety in Numbers" operated in reverse. Pedestrian DSHI fell to 74% of pre-law numbers (Table 3), thanks to the road safety campaign already mentioned. Cyclist DSHI fell to 57% of pre-law numbers, but there were fewer cyclists – only 69% as many as before the law (Table 2). DSHI should therefore have fallen to (69% x 74%) = 52% of pre -law numbers for cyclists to enjoy the same injury reductions as pedestrians. The actual fall suggests that cyclists did not fare as well with the helmet law as they ought to have done without it. An increase in injury rates following helmet laws was also noted for child cyclists in NSW (Robinson, 1996). Thus, as predicted by the Growth Rule, the risk per cyclist increased when cycling decreased because of helmet laws in Australia.
Conclusion
Successful road safety measures that have benefited cyclists and all other road users include random breath testing (Fig 3) and the intensive anti-speeding anti- drink-driving campaign in Victoria that reduced pedestrian fatalities from 159 in 1989 to 93 in 1990.
Jacobsen's work shows that, in conjunction with such measures, safety per cyclist can best be improved by encouraging more people to cycle. This is a 'win -win' situation because encouraging cycling also improves health and is beneficial to the environment. Policies that affect amount of cycling (including helmet laws) should be reviewed and potential increases in injuries per cyclist calculated using the Growth Rule. Maximum benefit will be achieved by policies encouraging cycling and making it a safe, healthy, enjoyable and environmentally friendly activity.
Appendix - TAC data: definition of head injury
Data in Table 3 were based on TAC's definition of serious head injury, which includes skull fractures and brain injuries. Conven- tionally, serious injuries are those requiring admission to hospital. For South Australia, Laurie (1992) stated: "it is understood that, since helmet wearing became compulsory, the procedure for patients with a short episode of concussion has changed in that such patients are not now admitted routinely" (Laurie, 1992) The effect is also evident in TAC data from Victoria. Compared with the 2 years before the helmet law, numbers of concussions to pedestrians fell by 29% and 75% in the first and second years of the bicycle helmet law.
The most widely cited helmet law analysis stated: "(TAC) insurance claims from bicyclists killed or admitted to hospital after sustaining a head injury decreased by 48% and 70% in the first and second years after the law, respectively. Analysis of the injury data also showed a 23% and 28% reduction in the number of bicyclists killed or admitted to hospital who did not sustain head injuries in the first and second post-law years, respectively" (Cameron, Vulcan, Finch and Newstead, 1994). However, the 48% and 70% reductions were obtained using a different classification to that provided by TAC for Table 3. Cyclists with any injury in ICD-9 classifications 850-854 (concussion), 872 (open wound of ear), or 873.0, 873.1, 837.8, 873.9 (open wounds to head) – whether or not this was the reason for admission to hospital – were included in the total number of "bicyclists killed or admitted to hospital after sustaining a head injury". (Cameron, Vulcan, Finch and Newstead, 1994)
Table 3, based on TAC's classification of the most serious injury, shows that changes in the proportion of cyclists admitted to hospital for serious head injury were no different from those for pedestrians. Thus the widely-quoted claims of 48% and 70% reduction in cyclist head injuries were due either to the changes in admission procedures or road safety conditions (resulting in 29% and 75% reductions in numbers of pedestrians with concussion in years 1 and 2 of the helmet law), or reductions in head wounds to cyclists admitted to hospital for treatment of serious injuries to other parts of the body.
References
Adams 1985
Adams J, 1985. Smeed's Law, seatbelts and the Emperor's new clothes. In Schwing RC, ed Human behavior and traffic safety New York, pp 193-253.
Cameron, Vulcan, Finch and Newstead, 1994
Cameron MH, Vulcan AP, Finch CF, Newstead SV, 1994. Mandatory bicycle helmet use following a decade of helmet promotion in Victoria, Australia - an evaluation. Accident Analysis & Prevention 1994;26(3):325-337.
Carr, Dyte and Cameron, 1995
Carr D, Dyte D, Cameron MH, 1995. Evaluation of the bicycle helmet wearing law in Victoria during its first four years. Monash University Accident Research Centre Report 76.
Finch, Heiman and Neiger, 1993
Finch C, Heiman L, Neiger D, 1993. Bicycle Use and Helmet Wearing Rates in Melbourne, 1987 to 1992: the influence of the helmet wearing law. Monash University Accident Research Centre Report 45. 
FORS, 1988
INSTAT. Day-to-day travel in Australia 1985-96. Federal Office of Road Safety, February 1988.
Hudson, 1978
Hudson M, . The Bicycle Planning Book. Friends of the Earth, 1978..
Jacobsen, 2003
Jacobsen PL, 2003. Safety in numbers: more walkers and bicyclists, safer walking and bicycling. Injury Prevention 2003;9:205-209.
Knott 1994
Knott JW, 1994. Road traffic accidents in New South Wales, 1881 - 1991. Australian Economic History Review 1994;34:80-116.
Laurie, 1992
Laurie S, . The effect of compulsory bicycle helmet legislatin on injuries of patients hospitalised in South Australia following bicycle accidents. Research project, Flinders Univerisity, in conjunction with injury control unit of SA Health Commission, 1992.
Powles and Gifford, 1993
Powles JW, Gifford S, 1993. Health of nations: lessons from Victoria, Australia. BMJ 1993 Jan 9;306(6870):125-7.
Robinson, 1996
Robinson DL, 1996. Head injuries and bicycle helmet laws. Accident Analysis & Prevention 1996 Jul;28(4):463-75.
Robinson, 2005b
Robinson DL, 2005. Safety in numbers in Australia: more walkers and bicyclists, safer walking and bicycling. Health Promotion Journal of Australia 2005;16:47-51.
Smeed, 1949
Smeed RJ, 1949. Some statistical aspects of road safety research. J R Stat Soc A 1949:1-34.
See also