Changes in cycle use in Australia
Summary
The enactment of helmet laws in Australia in the early 1990s had a major impact on cycle use. Whereas cycle use prior to the laws had been generally increasing, as soon as laws were passed and enforced cycle use fell sharply.
This page looks at the evidence that is available, nationally and state by state, on trends in cycle use since the passing of helmet laws.
See also: Australian cyclist numbers and population 1985/86 - 2011 
Raw data and sources for this page
Introduction
There were early signs that helmet compulsion might cause some people to give up cycling, such as when many students at schools in Victoria chose to give up cycling when they were required to wear helmets pre-law (AHoR, 1985b). It would therefore have been sensible for governments to ensure that the effect of compulsory wearing on numbers of cyclists was monitored accurately. This was not done, but some measurements of numbers were made, most being incidental to surveys of helmet wearing.
The national picture
The graph below shows census data (ABS, census) on cycling to work (single mode journeys), according to whether helmet laws were enforced at the time of the 1991 census, splitting the data using numbers cycling to work in capital cities (Mees, Sorupia and Stone, 2007) versus the rest of the state. Details of methods used to obtain a consistent series are provided in an Appendix. Northern Territory has been omitted from this graph as its helmet law was effectively abandoned for adults in 1994 – see state details below.
The average for all states with enforced laws at the time of the 1991 census (red lines on the graph below) was a reversal of the trend of increasing percentages of people cycling to work. In contrast, the percentage cycling to work in states with no enforced helmet laws (blue lines on graph – WA, ACT and Qld) continued to increase, the sharp decline occurring only in the 1996 census, when helmet laws were enforced throughout Australia.
There has been no recovery to pre-law levels – the trend continued downward over the next decade, followed by a slight increase in some states in the 2006 and 2011 censuses as health authorities in some states try to counteract increasing health problems, due to inactivity and obesity, by increased promotion of cycling.
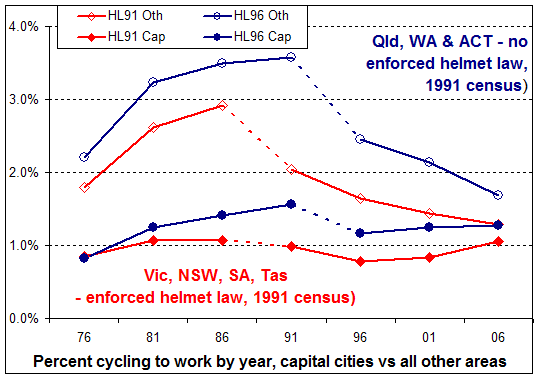
An interesting aspect of the census data is the much higher proportions cycling to work in regional cities and rural areas. The 1986 census recorded 40,798 people cycling to work in non-capital cities, very similar to the 43,218 cycling to work in capital cities.
The much higher percentages cycling to work in non-capital cities might reflect the shorter travel distances (in 2006, only 15% of capital city residents lived within 5 km of work, compared to 29% of those living elsewhere in their state or territory – ABS, 2006�) as well as lower traffic volumes, which is likely to be associated with lower perceived danger of cycling. Kathy Francis, founding member of Freestyle Cyclists (an Australian organisation lobbying for repeal of mandatory helmet laws), explains that she lived “in a country town where it was very safe to ride. I thought the helmet law was a crock and was fined repeatedly. I refused to pay, and was eventually was put in jail, pregnant, for 24 hours."� (Chappelli, 2012)�
The much greater reductions in cycling to work in non-capital cities suggests that helmet laws might have considerably more impact on cycle use in areas where safety is not an issue. Cyclists concerned about safety are likely to choose to wear helmets irrespective of laws. But for other cyclists, the discomfort and inconvenience of being forced to wear helmets is likely to be the most significant deterrent. Government advertising programs urging compliance helmet law emphasized the dangers of cycling, are, however, likely to have created additional concerns about safety in areas that were previously considered safe, leading over time to further reductions in cycle use.
Further gradual reductions in cycling to work over time would also be expected because of the 44% reduction in children’s cycling in NSW two years of the helmet law, and 46% reduction in teenage cycling in Victoria. As these children become adults and enter the workforce, their lack of cycling experience as children is likely to result in a lower proportion choosing this method of transport.
The table below shows the proportion of single-mode journeys to work made by cyclists in the whole of Australia (including NT). The proportion in 2011 remains much lower than the peak level prior to the helmet laws, despite recent increases in the price of petrol.
|
Cycling to work in the whole of Australia
|
|
1976
|
1981
|
1986
|
1991
|
1996
|
2001
|
2006
|
2011 |
|
1.12%
|
1.56%
|
1.68%
|
1.56%
|
1.24%
|
1.21%
|
1.24%
|
1.29% |
|
Census data
|
Walking to work
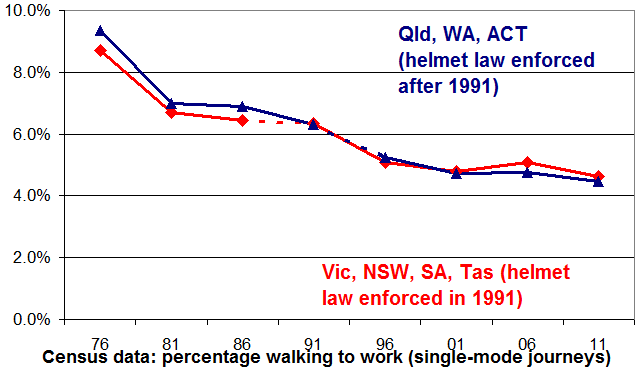
Unlike cycling, which was increasing until the introduction of helmet laws, walking to work has been in steady decline since the 1976 census. The same division into states with and without helmet laws at the 1991 census does not reveal any difference in trends. This suggests that the obvious differences in cycling to work between states with and without enforced helmet laws in 1991was due to helmet laws.
Individual states
The graph below summarises the effect of the helmet law in individual states. Those that made bicycle helmets compulsory at least 6 months before the 1991 census were Vic (1 July 1990), Tas (1 Jan 1991) and NSW (adults): 1 Jan 1991. The trend from 1986-91 in all these states was below that from 1981-86.
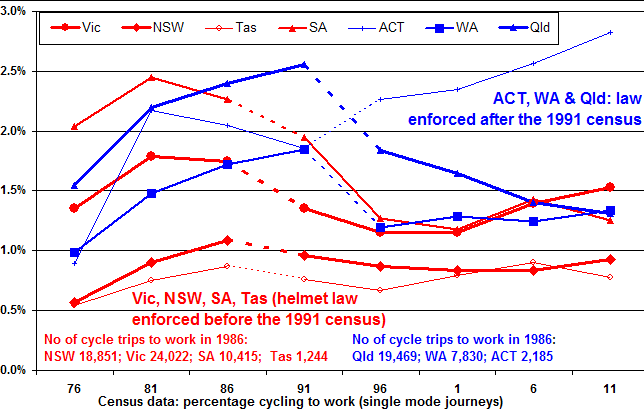
In SA the law was introduced on 1 Jul 1991, a few weeks before the 1991 census on 6 August. As in some other states, the law may not have been enforced immediately. In SA, there was a greater reduction in cycling to work from the 1991 to the 1996 census than from 1986-91.
In WA, the law was introduced on 1 Jan 1992 and enforced from 1 July 1992. In Qld, no provision was made for penalties and the law was widely ignored (about 50% of adults wore helmets) until 1 Jan 1993, when penalties were introduced. The greatest declines in cycling to work in these states were seen from the 1991 to 1996 census. In the seat of government, the Australian Capital Territory, cycling continued to increase despite the helmet law.
New South Wales Law commenced 1 January 1991 adults, 1 July 1991 children
Prior to the law, cycling was growing strongly in New South Wales, with an increase of 250 per cent during the 1980s in Sydney (BFA, 1992).
Children
Matched official surveys counted 6,072 child cyclists (under 16) passing survey sites in April 1991, before the helmets law commenced to apply to them on 1 July, and 3,887 and 3,478 passing the same sites in April 1992 and 1993, declines of 36 and 43 per cent respectively (Smith and Milthorpe, 1993). The largest recorded reduction in cycling was among secondary female students in Sydney: 214 in 1991 down to 20 in 1993, a drop of 90.6 per cent. The decline in the number of children observed cycling was 5 times that of the number who started to wear a cycle helmet (569 v 2,658).
Although the survey sites were not chosen as a representative sample, consistent across-the-board reductions in numbers counted were found at road intersections, at school gates and in recreational areas, as well as in Sydney inner rural and outer rural areas. This suggests that an almost identical result would have been obtained whatever the choice of sample sites and the declines stated above are realistic estimates of the reduction in cycling.
Adults
The only survey that counted adults in NSW before the helmet law was at a different time of year to the post-law surveys, so it is not possible to determine the effect of the law on adult cycling.
Cycling in Sydney
A consistent series of counts were conducted in 12 of the 36 statistical divisions in Sydney (Walker, 1996).� In 1990 (pre-law) and 1996 the counts were in October. In other years, the counts were in April. All except the 1991 count (post-law for adults, pre-law for children), took place after the helmet law.
Of note was the general decrease in numbers of cyclists from 1991 (4405 cyclists counted) to 1996 (2269 counted), a 48% decline. Poor weather conditions were suggested as a factor decreasing the numbers of cyclists in 1990 and 1996. The author of this report also suggested that October might be a less favourable month for cycling than April.
The surveys showed that helmet wearing of adults stabilised at 75-80%, whereas only about 50% of children wore helmets in the 1994 and 1996 surveys.
Number of cyclists (all ages) counted at 25 sites in Sydney (from Walker, 1996)
Census data shows that in 2006 there had still not been a recovery following the decline in people cycling to work (ABS, census):
|
Cycling to work in New South Wales
|
|
1976
|
1981
|
1986
|
1991
|
1996
|
2001
|
2006
|
2011 |
|
0.56%
|
0.90%
|
1.09%
|
0.96%
|
0.87%
|
0.83%
|
0.84%
|
0.93% |
|
Census data
|
Victoria Law commenced 1 July 1990
In 1989 (before the helmet law), there were estimated to be 2.2 million cyclists in Victoria, of whom 1.4 million were in Melbourne. Cycling had been increasing for some years – in Melbourne there was an increase of 47 per cent in the number of cyclists from 1986 to 1989 (Lambert, 1990). Population growth during the same period was 7.5 per cent.
The helmet law saw a large downturn in cycling. Total bicycle use by children aged 5-17 decreased by 36 per cent from May/June 1990 to May/June 1991 (Cameron, Heiman and Neiger, 1992). There were further decreases to May/June 1992 in Melbourne, with teenage cycling showing by then a 46 per cent decrease from pre-law levels (Finch, Heiman and Neiger, 1993).
Total numbers of child and adults cyclists counted are shown in the table below, as well as numbers wearing helmets. Notably, the decrease in numbers of child cyclists counted is much greater than the increase in numbers wearing helmets.
By 1992, the reduction in numbers counted was much less, however it appears that, although surveys conducted on weekdays had similar weather, there were some differences for counts conducted on Saturdays and Sundays. In 1992, only 14% of weekend observations were affected by rain, compared with about half of weekend observations in 1991 and 32% in the 1990 pre-law count. In addition, counts were inflated by a bicycle rally passing through one of the sites in 1992. Excluding the site with the rally, despite the better weather in 1992, a total of 27% fewer cyclists were counted in 1992 than 1990.
Numbers of cyclists counted at 64 sites in Melbourne (N)
and numbers wearing helmets (NH)
|
| |
Pre-law
May/June 1990 |
First law year
May/June 1991 |
Second law year
May/June 1992 |
| |
N |
NH |
N |
NH |
N |
NH |
| Child cyclists |
1,554 |
442 |
905 |
485 |
994 |
637 |
| Change from 1990 |
|
|
-649 |
+43 |
-560 |
+195 |
| Adult cyclists |
1,567 |
564 |
1,106 |
818 |
1,484 |
1,247 |
| Change from 1990 |
|
|
-461 |
+254 |
-83 |
+683 |
In 1985-6, 3.4 per cent of trips in Melbourne were by bicycle. In 2004 this was only 2.0 per cent, suggesting that cycling was still much reduced compared with before the helmet law (ABC, 2004).
Census data shows that the proportion of people cycling to work in 2006 was growing again but was still much lower than the pre-law levels of the 1980s (ABS, census):
|
Cycling to work in Victoria
|
|
1976
|
1981
|
1986
|
1991
|
1996
|
2001
|
2006
|
2011 |
|
1.35%
|
1.79%
|
1.75%*
|
1.36%
|
1.15%
|
1.15%
|
1.40%
|
1.53% |
|
Census data
|
A newspaper article in 1996 quotes MUARC researcher Max Cameron that “his studies of bicycle-related hospital admissions showed conclusively that helmets worked. For four consecutive years after helmets became compulsory, we had a 40 percent drop in head injuries over what we had before. We have no indication that any injuries were caused by helmets. Of all cyclists killed by cars, 80 per cent have suffered head injuries," Mr Cameron said. (Strong, 1996)
Thus the public were led to believe that helmets were the major cause of the decline in head injury, despite the substantial reductions in hospital admissions for non-head injury, as well as surveys showing a 46% reduction in teenage cycling (a particularly high-risk group), and improvements in the safety of all road users. It remains a matter of speculation why government-funded accident researchers apparently sought to justify the legislation by mis-representing the major reasons for the reduction in head injuries.
There are some signs of an increase in cycling in the City of Melbourne's Central Business District where 2007 figures show bicycles as 8% of peak-hour (7am-10am) vehicles (Melbourne, 2007). However, population in this area is estimated to have more than doubled since 1996, from 39,716 to 85,844 people (Melbourne, 2007). Also, the City of Melbourne's own figures for 2006 showed only 2% of workers commuting by bicycle (Melbourne, 2007b).
See also: Victorian Auditor overlooks public health disaster (data on Victorian cycling trends)
Queensland Law commenced 1 July 1991, enforced January 1993
The Royal Automobile Club of Queensland conducted surveys, mainly of cycling to schools, which showed a decline of 22 per cent from 1990 to 1991 (Wikman and Sims, 1991). Owing to changes in the survey conditions, however, the real decline probably exceeded 30 per cent - and it occurred before the law was enforced.
Census data shows a large fall in the proportion of people cycling to work since enactment of the state's helmet law and that the decline continued in 2006. In that year the proportion of people cycling to work was 45 per cent lower than in 1991 (ABS, census):
|
Cycling to work in Queensland
|
|
1976
|
1981
|
1986
|
1991
|
1996
|
2001
|
2006
|
2011 |
|
1.55%
|
2.20%
|
2.40%
|
2.56%
|
1.84%
|
1.65%
|
1.41%
|
1.31% |
|
Census data
|
South Australia Law commenced 1 July 1991
The Office of Road Safety, in reporting its evaluation of helmet legislation, said “Due to the disparate nature of the results from different sources, it is not possible to be conclusive about the effect of the requirement to wear bicycle helmets on the number of cyclists” (Marshall and White, 1994). The report noted that Harrison's (1994) study of school children showed a 38 per cent decline in cycling from September 1988 to March 1994. This is likely to under-estimate the decline due to the helmet law because cycling is more popular in March than September in southern Australia.
Census data shows that the law led to a 48 percent fall in the proportion of people cycling to work in 2001 compared with 1986, with a small increase in 2006 (ABS, census):
|
Cycling to work in South Australia
|
|
1976
|
1981
|
1986
|
1991
|
1996
|
2001
|
2006
|
2011 |
|
2.04%
|
2.45%
|
2.27%
|
1.95%
|
1.27%
|
1.17%
|
1.43%
|
1.25% |
|
Census data
|
Western Australia Law commenced 1 January 1992, enforced July 1992
Before the law, cycling was enjoying a tremendous increase in popularity in Western Australia. The number of regular cyclists in Western Australia almost doubled between 1982 and 1989 from 220,000 to 400,000 (Robinson, 2005b).
The law saw the start of a serious decline in cycling, as cycle use in Western Australia fell quickly by 30 per cent or more
Automatic counters installed on two key cyclist bridges over the Swan river in the capital city of Perth recorded the following weekday cycle movements, averaged over 12 months (July - June) (MRWA, 2001; MRWA, 2006):
|
Average weekday cycle movements, Causeway and Narrows bridges, Perth
|
| Pre enforcement |
Post enforcement |
|
1991-92
|
1992-93 |
1993-94 |
1994-95 |
1995-96 |
1996-97 |
1997-98 |
1998-99 |
1999-00 |
2000-01 |
2001-02 |
2002-03 |
2003-04 |
2004-05 |
2005-06 |
|
2,021*
|
1,530
|
1,310
|
1,160
|
1,250
|
1,500 |
1,570 |
1,530# |
869#
|
2,214
|
2,283
|
2.339
|
1,986
|
1,901
|
1,959
|
Although the 12-month averages are the best record of year-round cycling from 1992, they are not the fairest comparison pre/post law enforcement as the 1991-1992 counts were based on only 9 months. Limiting the count data for all years to 9 months (October to June) shows the following trends::
|
Average weekday cycle movements Oct-June each year, Causeway and Narrows bridges, Perth
|
| Pre enforcement |
Post enforcement |
|
1991-92
|
1992-93 |
1993-94 |
1994-95 |
1995-96 |
1996-97 |
1997-98 |
1998-99 |
1999-00 |
2000-01 |
2001-02 |
2002-03 |
2003-04 |
2004-05 |
2005-06 |
|
2,021
|
1,575
|
1,547
|
1,340
|
1,422
|
1,791 |
1,678 |
2,405# |
985#
|
2,445
|
2,382
|
2,563
|
2,169
|
2,052
|
2,158
|
Another analysis estimated that the decline in cycling on these bridges over each of the first 3 years of the helmet law was 20 per cent, 24 per cent and 35 per cent (Robinson, 1996).
The population of Western Australia has been increasing – with 27 per cent growth between 1991 and 2006. Perth has experienced a similar population increase, concentrated particularly in areas close to the Swan river bridges and this might therefore be expected to increase the number of people cycling. To reflect the changing population, the following table shows cycle movements over the Swan river bridges per 1,000 population and based on the 9-month averages shown above (ABS, pop):
|
Average weekday cycle movements Oct-June per 1,000 population, Causeway and Narrows bridges, Perth
|
|
Averaged over
|
Pre enforcement |
Post enforcement |
|
1991-92
|
1992-93 |
1993-94 |
1994-95 |
1995-96 |
1996-97 |
1997-98 |
1998-99 |
1999-00 |
2000-01 |
2001-02 |
2002-03 |
2003-04 |
2004-05 |
2005-06 |
|
12 months
|
n/a
|
0.92
|
0.78
|
0.68
|
0.72
|
0.85
|
0.87
|
0.83
|
0.46#
|
1.17#
|
1.19
|
1.20
|
1.01
|
0.95
|
0.96
|
|
9 months
|
1.23
|
0.95
|
0.92
|
0.79
|
0.82
|
1.01
|
0.93
|
1.30
|
0.52#
|
1.29#
|
1.24
|
1.32
|
1.10
|
1.02
|
1.06
|
This shows that there has been no lasting recovery in cycle use relative to population since the enactment of the helmet law. The temporary growth in cycling from 2000 to 2002 coincided with an AUD 1.5 million cycling promotion campaign by the WA Government, but the same level of cycle use appears not to have been maintained when this ended. Moreover, there has been the loss of potentially many more years of cycling growth following on from the large increase in cycling pre-law.
In the five years following 1991, the number of children cycling to school fell by more than a half (Bikewest, 1996). A 1992 survey commented that the number of children cycling to primary schools and the number of recreational cyclists declined from 1991 to February 1992 (Healy and Maisey, 1992). Over the first three years of the law, there was an average decline in cycle use of 26 per cent on weekdays and 40 per cent on Sundays, suggesting that optional recreational cycling was particularly discouraged (Heathcote, 1993). A 1993 survey presents limited data which show a decline in numbers of WA children cycling to school (Heathcote, 1993) and a decline of over 50 per cent for cycling classed as recreational. One bike hire company reported the loss of 90 per cent of its business overnight. Within 6 months of the law, 5 cycle shops went bankrupt and bike sales were down by 70 per cent (CW, 1993).
A large and continuing fall in utility cycling can be seen from census data for cycling to work (ABS, census):
|
Cycling to work in Western Australia
|
|
1976
|
1981
|
1986
|
1991
|
1996
|
2001
|
2006
|
2011 |
|
0.98%
|
1.48%
|
1.72%
|
1.85%
|
1.20%
|
1.28%
|
1.25%
|
1.34% |
|
Census data
|
This shows a fall of 33 per cent in cycling to work since 1991 despite the cycling promotion campaign by the WA Government in 2000 and a doubling of petrol prices over the period. A 2004 report noted that there had been a shift away from regular utility cycling and in the average age of cyclists, with considerably fewer children riding (WAust, 2004).
Further information about Western Australian cycling levels is available here.
Australian Capital Territory Law commenced 1 July 1992
Automatic counters on bicycle paths registered declines from 1991 to a similar period in 1992 of about one third on weekdays and about half at weekends (Ratcliffe, 1993).
Census data shows that, despite the law, the proportion of people cycling to work continued to increase (ABS, census):
|
Cycling to work in ACT
|
|
1976
|
1981
|
1986
|
1991
|
1996
|
2001
|
2006
|
2011 |
|
0.90%
|
2.17%
|
2.05%*
|
1.86%
|
2.27%
|
2.35%
|
2.56%
|
2.82% |
|
Census data
|
Northern Territory Law commenced 1 January 1992, amended 1994
After the law was first introduced, a street survey in Darwin found that 20 per cent of people had given up cycling as a result of the law and 42 per cent cycled less (Mead, 1993).
The Road Safety Council of the Northern Territory did surveys which showed there was little change just after the law in the numbers of children cycling to primary schools, but a decline of 17 per cent by the following year. Numbers cycling to secondary schools declined by 36 per cent soon after the law and were down 39 per cent within a year (Van Zyl, 1993; RSCNT, 1993). These figures would under-estimate the effect of the law because two of the schools surveyed had themselves introduced compulsory wearing before the law. One report on the surveys noted that secondary students had earlier advised that "if it was made compulsory to wear helmets they would decide whether to comply or not to ride".
Counts of commuter cyclists showed a dramatic decline of about half following the law (RSCNT, 1993b):
|
Cycle commuters in Northern Territory
|
| Pre-law |
Post-law |
| Aug 1990 |
Apr 1991 |
Aug 1991 |
Apr 1992 |
August 1992 |
August 1993 |
|
252
|
222
|
350
|
142
|
122
|
131
|
Census data shows a 36 per cent decline in the proportion of people cycling to work from 1991 to 2006 (ABS, census):
|
Cycling to work in Northern Territory
|
|
1976
|
1981
|
1986
|
1991
|
1996
|
2001
|
2006
|
2011 |
|
2.11%
|
3.81%
|
4.15%
|
5.55%
|
3.98%
|
3.95%
|
3.53%
|
3.24% |
|
Census data
|
One source suggests that the proportion of people cycling to work increased to 4.2 per cent following the NT law's amendment in 1994, the effect of which was to remove the need for adults to wear helmets on cycle paths while enforcement and helmet use fell greatly. At the same time there was an increase to 15.35 per cent of people cycling for recreation or sport and, significantly, an increase in the proportion of women cycling (ABC, 2004).
Tasmania Law commenced 1 January 1991
There would seem to be little data available about cycling in Tasmania.
Census data suggests that the helmet law had relatively little effect on the proportion of people cycling to work and that an initial fall after the law soon recovered (ABS, census). However, the number of people cycling in Tasmania is only a small proportion of a small population.
|
Cycling to work in Tasmania
|
|
1976
|
1981
|
1986
|
1991
|
1996
|
2001
|
2006
|
2011 |
|
0.54%
|
0.75%
|
0.87%
|
0.76%
|
0.67%
|
0.80%
|
0.90%
|
0.78% |
|
Census data
|
Appendix – ABS census data on cycling to work
The question on method of travel to work has been asked in all censuses since 1976. The report for 1976 shows numbers for all modes of travel for people who went to work - a person who cycled and took the train is listed under both ‘Bicycle’ and ‘Train’. Reports for all other censuses provide separate tabulations for single, dual and multiple mode journeys. Both sets for tables were published for 1981.
To obtain a consistent series, tabulated state-wide data from 1981 onwards were based on single-mode journeys to work. Later census date report tables for multiple modes as specific combinations, e.g. ‘train and bus’, with ‘train and cycling’ included in the ‘train and other’ category, so it was not possible to estimate the proportion of multiple-mode journeys that included cycling. Estimated numbers of single-mode journeys in 1976 were calculated by multiplying numbers of multiple-mode journeys in each state by the ratio for that state of single to multiple journeys obtained from 1981 data.
Data on cycling to work in capital cities was extracted from Mees, Sorupia and Stone, 2007� Unlike the state-wide data, available as a consistent series tabulated as single, dual or multiple-mode journeys from 1991 onwards, Mees, Sorupia and Stone, 2007� tried to recreate a consistent series for capital cities data by ‘main mode of transport’. Mees, Sorupia and Stone, 2007 report that a ‘train and cycling’ trip would be classified with train as the main mode. It was therefore considered feasible, as shown in the spreadsheet calculations, to attempt to create a consistent series for cycling to work in non-capital cities by subtracting capital city data from the totals for each state. Although this is an approximation, it should be adequate to illustrate the trends over time.
In 1976, people who did not travel to work were asked about their usual method of travel to work (Mees, Sorupia and Stone, 2007). However, the state-wide tabulations include a separate category for people who did not travel to work, implying that the state-wide reports shows journeys to work on census day.
References
ABC, 2004
Australia bicycle ownership and use. Australian Bicycle Council, 2004.
ABS, 2006
4602.0 Environmental issues - people's views and practices, 2006. .
ABS, census
Census data from Australia Bureau of Statistics. .
ABS, pop
Population data from Australian Bureau of Statistics. .
AHoR, 1985b
Evidence Given to the Australian House of Representatives Standing Committee on Transport Safety 1985. p.1078.
BFA, 1992
Cycling in Europe. Proceedings of a national bicycle conference, Melbourne, March 1992. Bicycle Federation of Australia, 1992. .
Bikewest, 1996
Media release issued by Bikewest . - the cycling promotion and research department of the Western Australia government. 1996. .
Cameron, Heiman and Neiger, 1992
Cameron M, Heiman L, Neiger D, 1992. Evaluation of the Bicycle Helmet Wearing Law in Victoria During its First 12 Months. Monash University Accident Research Centre Report 32.
Carr, Dyte and Cameron, 1995
Carr D, Dyte D, Cameron MH, 1995. Evaluation of the bicycle helmet wearing law in Victoria during its first four years. Monash University Accident Research Centre Report 76.
Chappelli, 2012
Freestyle cyclists launch helmet law petition, 2012. .
CW, 1993
Oz helmet fiasco. Cycling Weekly, 11 December 1993.
Finch, Heiman and Neiger, 1993
Finch C, Heiman L, Neiger D, 1993. Bicycle Use and Helmet Wearing Rates in Melbourne, 1987 to 1992: the influence of the helmet wearing law. Monash University Accident Research Centre Report 45.
Healy and Maisey, 1992
Healy M, Maisey G, 1992. The impact of helmet wearing legislation and promotion on bicyclists in Western Australia. Traffic Board of Western Australia .
Heathcote, 1993
Heathcote B, 1993. Bicycle helmet wearing in Western Australia. Western Australia Police Department .
Hendrie, Legge, Rosman and Kirov, 1999
Hendrie D, Legge M, Rosman D, Kirov C, 1999. An Economic Evaluation of the Mandatory Bicycle Helmet Legislation in Western Australia. Road Accident Prevention Research Unit .
Lambert, 1990
Lambert J, 1990. Number of cyclists, bicyclist trips and bicyclist accident reports in Victoria, 1986 - 1989. Vic Roads internal report, May 1990 .
Marshall and White, 1994
Marshall J, White M, 1994. Evaluation of the compulsory helmet wearing legislation for bicyclists in South Australia. South Australia Dept of Transport Report 8/94.
Mead, 1993
Mead P, . Bike helmet survey results. CTRAC, Alice Springs, October 1993.
Mees, Sorupia and Stone, 2007
Mees P, Sorupia E, Stone J, 2007. Travel to work in Australian capital cities, 1976-2006: an analysis of census data. GAMUT - Australian Centre for the Governance and Management of Urban Transport .
Melbourne, 2007
Melbourne - a snapshot. City of Melbourne, Town Hall 90-120 Swanston Street Melbourne, 3000 Victoria, Australia.
Melbourne, 2007b
Melbourne bicycle account - cycling census 2007. City of Melbourne, Town Hall 90-120 Swanston Street Melbourne, 3000 Victoria, Australia.
MRWA, 2001
Cyclist survey data from Main Roads, Western Australia, 1992 - 2001. .
MRWA, 2006
Cyclist survey data from Main Roads, Western Australia, 2000 - 2006. .
Ratcliffe, 1993
Ratcliffe P, 1993. Bicycling in the ACT - a survey of bicycle riding and helmet wearing in 1992. ACT Dept of Urban Services .
Robinson, 1996
Robinson DL, 1996. Head injuries and bicycle helmet laws. Accident Analysis & Prevention 1996 Jul;28(4):463-75.
Robinson, 2005b
Robinson DL, 2005. Safety in numbers in Australia: more walkers and bicyclists, safer walking and bicycling. Health Promotion Journal of Australia 2005;16:47-51.
RSCNT, 1993
1993 Bicycle helmet survey report. Road Safety Council of the Northern Territory.
RSCNT, 1993b
Private communication from. Road Safety Council of the Northern Territory, October 1993.
Smith and Milthorpe, 1993
Smith NC, Milthorpe MW, 1993. An Observational Survey of Law Compliance and Helmet Wearing by Bicyclists in New South Wales - 1993 (4th survey). NSW Roads & Traffic Authority ISBN 0-7305-9110-7.
Strong, 1996
Strong G, . Hardhat defiance cops night in cell. Sunday Age, 12 May 1996.
Van Zyl, 1993
Van Zyl R, 1993. Bicycle helmet wearing in the Northern Territory. Road Safety Council of the Northern Territory .
Walker, 1996
Walker M, 1996. Bicycling in Sydney: law compliance and attitudes to road safety. Velo Australis .
WAust, 2004
West Australian, 10 March 2004. .
Wikman and Sims, 1991
Wikman J, Sims C, . Bicycle helmet wearing surveys 1990 and 1991. Royal Automobile Club of Queensland, Brisbane .
See also