
Quantifying the risk of head injury to child cyclists in England: an analysis of hospital admissions data
Franklin JA, Chapman G, BHRF 2005
Introduction
The promotion of cycling has been tempered in recent years by concerns about head injury when cycling. Estimates of the size of the problem have varied, some helmet promotion campaigns suggesting that tens of thousands of child cyclists suffer serious head injuries each year in the UK. There appears to be a common perception that cycling is exceptionally productive of head injuries in children. However, there has been little research into the extent of head injury or to put into perspective the relative incidence through cycling. This paper sets out to establish the scale of head injuries to children in England and the proportion attributable to cycling.
Methodology
The authors were given access to an extract of Department of Health hospital admissions data for children under 16 years of age in England from 1995/6 to 2002/3. Comprising admissions related to ICD-10 codes below X60, all accidental injuries were included, but not those for intentional or self-inflicted injuries. Data were based on primary diagnosis.
The data were sorted initially by cause codes plus a coarse classification of primary diagnosis codes. This established the proportions of head and total injuries from cycling compared with other activities. Next a more detailed analysis of diagnosis codes was undertaken. This yielded information about the seriousness of head injuries and enabled a comparison of risks to child cyclists and child pedestrians, and of injuries with and without motor vehicle involvement.
A hospital admission is not the same as a treatment event. Most injuries treated in A&E, minor injury units and GP clinics, are relatively trivial. Children in particular are likely to be taken to A&E after any blow to the head as a precaution; routine admission for observation on precautionary grounds is similarly common. These factors need to be taken into account when assessing the number of head injuries leading to trauma.
Results
Cycling in context
Table 1 summarises child injury admissions by cause and whether head injury was the principal diagnosis. Note that the statistics for pedestrian injuries refer only to collisions with a vehicle, but cyclist injuries include all circumstances, on and off road.
|
Cause
|
Coarse Diagnosis
|
1995-96
|
1996-97
|
1997-98
|
1998-99
|
1999-00
|
2000-01
|
2001-02
|
2002-03
|
|
Cyclist
|
Head injuries
|
3,514
|
3,640
|
3,256
|
2,799
|
3,464
|
2,865
|
2,450
|
2,183
|
|
Injuries to other body regions
|
3,785
|
4,296
|
4,473
|
3,899
|
4,993
|
4,369
|
4,129
|
3,621
|
|
Pedestrian
|
Head injuries
|
1,840
|
2,031
|
1,987
|
1,866
|
1,841
|
1,697
|
1,768
|
1,498
|
|
Injuries to other body regions
|
2,009
|
2,240
|
2,269
|
2,254
|
2,189
|
2,010
|
2,220
|
1,931
|
|
Other land transport
|
Head injuries
|
1,508
|
1,592
|
1,279
|
1,244
|
1,248
|
1,211
|
1,181
|
1,181
|
|
Injuries to other body regions
|
1,770
|
1,855
|
1,728
|
1,620
|
1,909
|
1,848
|
2,170
|
2,284
|
|
Non-transport
|
Head injuries
|
26,464
|
30,202
|
30,028
|
29,444
|
30,950
|
27,601
|
27,612
|
25,954
|
|
Injuries to other body regions
|
41,762
|
49,144
|
51,952
|
50,867
|
54,879
|
50,305
|
52,242
|
51,558
|
|
Totals
|
82,652
|
95,000
|
96,972
|
93,993
|
101,473
|
91,906
|
93,772
|
90,210
|
|
Table 1: Child injury admissions by cause and coarse diagnosis
|
Head injuries to children cycling, walking and using other transport declined steadily over the survey period. In 2002-03, there were just over 2,000 child hospital admissions due to head injury when cycling.
Table 2 compares head injuries to child cyclists with other child head injuries. The relative significance of cycling as a cause of head injury declined from 1995-2002, being associated with only 7.1% of head injuries in 2002-03. This takes no account of exposure, which is difficult to quantify, particularly for off-road cycling.
|
Cause
|
1995-96
|
1996-97
|
1997-98
|
1998-99
|
1999-00
|
2000-01
|
2001-02
|
2002-03
|
|
Cyclist
|
10.5%
|
9.7%
|
8.9%
|
7.9%
|
9.2%
|
8.6%
|
7.4%
|
7.1%
|
|
Pedestrian
|
5.5%
|
5.4%
|
5.4%
|
5.3%
|
4.9%
|
5.1%
|
5.4%
|
4.9%
|
|
Other land Transport
|
4.5%
|
4.2%
|
3.5%
|
3.5%
|
3.3%
|
3.6%
|
3.6%
|
3.8%
|
|
Non-transport
|
79.4%
|
80.6%
|
82.2%
|
83.3%
|
82.5%
|
82.7%
|
83.6%
|
84.2%
|
|
Totals
|
99.9%
|
99.9%
|
100.0%
|
100.0%
|
99.9%
|
100.0%
|
100.0%
|
100.0%
|
|
Table 2: Child head injury admissions by cause as a percentage of total HI admissions
|
Table 3 and Figure 1 show the proportion of all injuries that involve head injury (%HI) for each cause group and trends from 1995-2003. Cycling injuries are only slightly more likely to involve head injury than the average for all causes, whilst pedestrian injuries are substantially above the average.
|
Cause
|
1995-96
|
1996-97
|
1997-98
|
1998-99
|
1999-00
|
2000-01
|
2001-02
|
2002-03
|
|
Cyclist
|
48.1%
|
45.9%
|
42.1%
|
41.8%
|
41.0%
|
39.6%
|
37.2%
|
37.6%
|
|
Pedestrian
|
47.8%
|
47.6%
|
46.7%
|
45.3%
|
45.7%
|
45.8%
|
44.3%
|
43.7%
|
|
Other transport
|
46.0%
|
46.2%
|
42.5%
|
43.4%
|
39.5%
|
39.6%
|
35.2%
|
34.1%
|
|
Non-transport
|
38.8%
|
38.1%
|
36.6%
|
36.7%
|
36.1%
|
35.4%
|
34.6%
|
33.5%
|
|
All
|
40.3%
|
39.4%
|
37.7%
|
37.6%
|
37.0%
|
36.3%
|
35.2%
|
34.2%
|
|
Table 3: Percentage of admissions for each cause with head injury as principal diagnosis
|
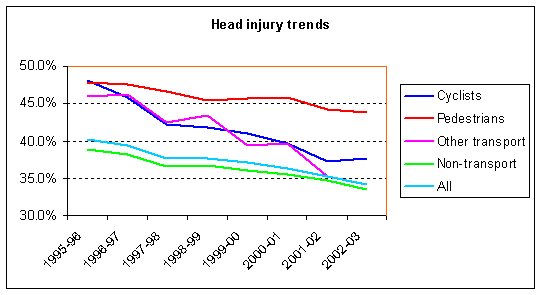
%HI when cycling reduced by 21.8% over the period, a figure comparable with that for 'other transport' injuries (25.8%). By contrast, the proportion of head injuries suffered by child pedestrians fell by only 8.5%.
It might be thought that the use of cycle helmets played a part in the decline in %HI of cyclists over the period, especially as child cyclists did so much better than child pedestrians. However, as shown in Table 4, cycle helmet use by children in Great Britain did not change significantly over the period (Gregory, Inwood and Sexton, 2003), and for boys (who account for 5 out of 6 injuries in this age group – DETR, 1996) use declined progressively.
|
|
1994
|
1996
|
1999
|
2002
|
|
Boys
|
16.0%
|
13.3%
|
12.7%
|
12.3%
|
|
Girls
|
21.9%
|
17.6%
|
20.9%
|
24.4%
|
|
All children
|
17.6%
|
14.3%
|
14.9%
|
15.2%
|
|
Table 4: Child helmet wearing in Great Britain
(source: Transport Research Laboratory)
|
Clearly other factors are dominant, especially as head injury has been declining across all cause groups.
Fatalities
The hospital admissions data provided no information to determine children who died as a result of their injuries, whilst those children pronounced dead at scene of accident would not have entered hospital. However, the Department of Health has undertaken a special analysis of child cyclist deaths in response to a Parliamentary Question (Jenkins, 2003) and this is reproduced in Table 5.
|
Child cyclist deaths
|
1995
|
1996
|
1997
|
1998
|
1999
|
2000
|
2001
|
2002
|
|
All causes
|
43
|
47
|
35
|
29
|
32
|
24
|
19
|
19
|
|
Head injury
|
31
|
34
|
25
|
18
|
20
|
14
|
12
|
10
|
|
% head injury
|
72%
|
72%
|
71%
|
62%
|
63%
|
58%
|
63%
|
53%
|
|
Table 5: Child cyclist fatalities
Note: Figures for 2001-2 may not be directly comparable to those of earlier years
due to changes in coding methodology in 2001.
|
Deaths due to head injury when cycling have declined markedly, both in absolute numbers and relative to total child cyclist deaths.
Secondary analysis of cyclist data
More detailed analysis was made of the diagnosis codes for child cyclists that had received a head injury, in order to assess the severity of these injuries and the relevance of cycle helmets in minimizing these.
Some assumptions were made:
- scalp lacerations were characterised as not serious, although a few will be;
- ligament injuries appear mainly to involve the jaw;
- a helmet may provide some protection to parts of the orbit, but numbers of injuries to the orbit are small and excluding these is on balance reasonable;
- traumatic amputation of a part of the head is assumed to refer to exposed parts such as the nose and ears.
The categories of injuries where cycle helmets, if effective, might be beneficial were therefore based on the following diagnosis codes:
S02: Fracture of skull and facial bones;
S04: Injury of cranial nerves;
S06: Intracranial injury;
S07: Crushing injury of head.
Including all fractures overstates the potential for helmets to be of benefit as this includes broken jaws and cheekbones. Similarly intracranial injury includes concussion, which often has no lasting consequences. These factors are likely to more than offset any bias introduced by the previous assumptions.
There remained a problem of what to do with injuries coded as S09, 'other or unspecified injuries of head'? We considered two possible approaches. One was to assume that these are mostly trivial – one may reasonably hope that few serious skull fractures would be coded as anything else, for example. Another was to assume that the split of serious and non-serious injuries is broadly similar to the balance of injuries with the unspecified injuries excluded.
The approach used was to assume that the unspecified injuries divide as the injuries of known severity. It may be that this, too, will overstate the potential for cycle helmets to provide benefit as the chance of any truly serious injury not being coded more precisely is, in our view, low. We acknowledge, however, that this is speculative.
Table 6 shows the breakdown of child cyclist head injuries by detailed diagnosis. It will be seen that in 2002-03 there were 370 head injuries that might reasonably be classified as serious, and where there might be potential for mitigation by cycle helmets.
|
Diagnosis Category
|
Diagnosis Description
|
1995-96
|
1996-97
|
1997-98
|
1998-99
|
1999-00
|
2000-01
|
2001-02
|
2002-03
|
|
Superficial injuries
|
Open wound of head
|
554
|
640
|
651
|
637
|
784
|
686
|
597
|
577
|
|
Superficial injury of head
|
348
|
414
|
411
|
356
|
458
|
372
|
341
|
340
|
|
Injuries where helmets probably irrelevant
|
Dislocation sprain & strain of joints & ligaments
|
16
|
20
|
24
|
13
|
36
|
21
|
16
|
17
|
|
Injury of eye and orbit
|
12
|
13
|
13
|
12
|
17
|
6
|
10
|
14
|
|
Traumatic amputation of part of head
|
1
|
1
|
0
|
1
|
1
|
2
|
0
|
1
|
|
Serious injuries where helmets might have an effect
|
Fracture of skull and facial bones
|
347
|
336
|
352
|
267
|
345
|
295
|
230
|
225
|
|
Injury of cranial nerves
|
0
|
1
|
2
|
2
|
0
|
0
|
1
|
1
|
|
Intracranial injury
|
755
|
713
|
485
|
312
|
328
|
213
|
193
|
144
|
|
Unspecified injuries
|
Other / unspecified head injuries
|
1,481
|
1,502
|
1,318
|
1,199
|
1,495
|
1,270
|
1,062
|
864
|
|
Table 6: Child cyclist head injuries by detailed diagnosis
|
If the unspecified injuries are included, in the same proportion as those of known severity, the number of head injuries where head protection might have been of assistance rises to at most 516.
Table 7 shows similar information for the whole survey period and gives these figures as percentages of all child injury admissions. Again, there has been a steady decline over the period.
|
|
1995-96
|
1996-97
|
1997-98
|
1998-99
|
1999-00
|
2000-01
|
2001-02
|
2002-03
|
|
Known serious injuries potentially mitigated by helmets
|
1,102
|
1,050
|
839
|
581
|
673
|
508
|
424
|
370
|
|
% all child admissions
|
1.3%
|
1.1%
|
0.9%
|
0.6%
|
0.7%
|
0.6%
|
0.5%
|
0.4%
|
|
Total assuming unspecified divide as others
|
1,566
|
1,483
|
1,179
|
830
|
963
|
733
|
608
|
516
|
|
% all child admissions
|
1.9%
|
1.6%
|
1.2%
|
0.9%
|
0.9%
|
0.8%
|
0.6%
|
0.6%
|
|
Table 7: Serious head injuries which might be mitigated by effective head protection
|
Motor vehicle involvement
Table 8 shows how head injuries to child cyclists split between those that resulted from a collision with a motor vehicle and those that did not.
|
|
Head injuries
|
1995-96
|
1996-97
|
1997-98
|
1998-99
|
1999-00
|
2000-01
|
2001-02
|
2002-03
|
|
Motor vehicle involvement
|
Total
|
493
|
504
|
406
|
395
|
457
|
370
|
318
|
280
|
|
% all MV injuries
|
57.2%
|
55.4%
|
52.1%
|
54.1%
|
52.8%
|
55.6%
|
50.0%
|
50.3%
|
|
Serious
|
190
|
188
|
146
|
136
|
142
|
105
|
99
|
86
|
|
% serious
|
38.5%
|
37.3%
|
36.0%
|
34.4%
|
31.1%
|
28.4%
|
31.1%
|
30.7%
|
|
No motor vehicle
|
Total
|
3,021
|
3,136
|
2,850
|
2,404
|
3,007
|
2,495
|
2,132
|
1,903
|
|
% all NMV injuries
|
46.7%
|
44.6%
|
40.9%
|
40.2%
|
39.5%
|
37.9%
|
35.8%
|
36.2%
|
|
Serious
|
925
|
876
|
706
|
458
|
549
|
411
|
335
|
299
|
|
% serious
|
30.6%
|
27.9%
|
24.8%
|
19.1%
|
18.3%
|
16.5%
|
15.7%
|
15.7%
|
|
% all injuries involving MV
|
11.8%
|
11.4%
|
10.1%
|
10.9%
|
10.2%
|
9.2%
|
9.6%
|
9.6%
|
|
Table 8: Motor vehicle involvement and head injury: child cyclists
|
Crashes involving a motor vehicle are more likely to result in head injury and to be serious. Nonetheless, the total number of serious injuries not involving motor vehicles (299 in 2002-3, Table 8) considerably exceeded those that did (86 in 2002-3). In both cases the proportion of serious injuries has declined markedly over the survey period although helmet use, as previously mentioned, remained static, with a decrease among boys most at risk. The decline over the period in the proportion of all injuries (not only head injuries) involving a motor vehicle may be a factor in the overall decrease in head injuries shown in Table 1.
Cyclists and pedestrians
Care is required in comparing injury rates for cyclists and pedestrians because all cyclist injuries are coded as cycling events even if no other vehicle is involved, but a pedestrian injury without a vehicle is likely to be coded under falls on the same level (W00 – W03, W18) or collisions with people and objects (W22, W51) rather than as pedestrian injuries (V01 to V09).
A like-for-like comparison of head injury rates for collisions with motor vehicles is shown in Table 9.
|
|
Head injuries
|
1995-96
|
1996-97
|
1997-98
|
1998-99
|
1999-00
|
2000-01
|
2001-02
|
2002-03
|
|
Child cyclists
|
Total
|
493
|
504
|
406
|
395
|
457
|
370
|
318
|
280
|
|
Serious
|
190
|
188
|
146
|
136
|
142
|
105
|
99
|
86
|
|
% serious
|
38.5%
|
37.3%
|
36.0%
|
34.4%
|
31.1%
|
28.4%
|
31.1%
|
30.7%
|
|
Child pedestrians
|
Total
|
1,840
|
2,031
|
1,987
|
1,866
|
1,841
|
1,697
|
1,768
|
1,498
|
|
Serious
|
687
|
784
|
684
|
561
|
537
|
466
|
457
|
384
|
|
% serious
|
37.3%
|
38.6%
|
34.4%
|
30.1%
|
29.2%
|
27.5%
|
25.8%
|
25.6%
|
|
Table 9: Comparison between child cyclists and pedestrians in crashes involving a motor vehicle
|
There is no exposure data by which to compare the likelihood of head injury, but in absolute terms many more child pedestrians suffer head injuries and serious head injuries each year in motor vehicle crashes than child cyclists. However, the proportion of head injuries that are serious declined faster for pedestrians and, in 2002-3 was greater for cyclists.
If all head injuries are considered (regardless of motor vehicle involvement) and all child pedestrian injuries are included, including cause codes W00 - W03, W18, W22, W51, the relative risk of head injury is as shown in Table 10.
|
|
Head injuries
|
1995-96
|
1996-97
|
1997-98
|
1998-99
|
1999-00
|
2000-01
|
2001-02
|
2002-03
|
|
Child cyclists
|
Total
|
3,514
|
3,640
|
3,256
|
2,799
|
3,464
|
2,865
|
2,450
|
2,183
|
|
Serious
|
1,115
|
1,064
|
852
|
594
|
691
|
516
|
434
|
385
|
|
% serious
|
31.7%
|
29.2%
|
26.2%
|
21.2%
|
19.9%
|
18.0%
|
17.7%
|
17.6%
|
|
Child pedestrians
|
Total
|
10,399
|
11,856
|
11,642
|
11,636
|
11,819
|
10,924
|
11,531
|
10,664
|
|
Serious
|
5,994
|
6,300
|
6,094
|
5,605
|
5,502
|
4,985
|
5,167
|
4,564
|
|
% serious
|
57.6%
|
53.1%
|
52.3%
|
48.2%
|
46.6%
|
45.6%
|
44.8%
|
42.8%
|
|
Table 10: Comparison between child cyclists and pedestrians: all events
|
In absolute terms, there are now 5 times as many head injuries to child pedestrians as child cyclists and, because a higher proportion of child pedestrian injuries are serious when motor vehicles are not involved, the proportion that are serious is much greater and is declining more slowly.
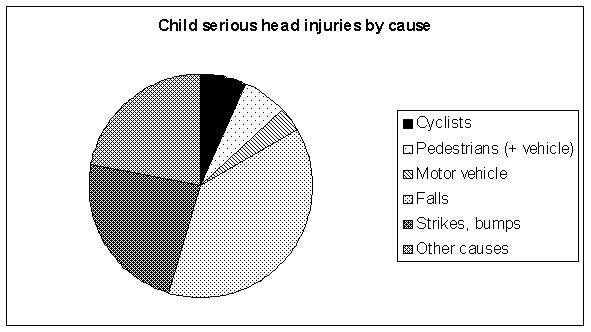
Cycling in context
Table 2 showed that in 2002-03 cycling was involved in only 7.1% of child head injury admissions. For serious head injuries the proportion is a little less, 6.5%. The relative risk of serious head injury for children is shown in more detail in Figure 2.
Discussion
Our analysis of hospital data for England has shown that the risk of head injury for children when cycling is small. The number of head injuries annually is now around 2,000, of which no more than a few hundred can be categorised as serious with the potential to be mitigated by cycle helmets. Deaths due to head injury are around 10 per year. We can see no basis for the much greater claims that are sometimes made.
While any head injury is to be regretted, in most cases there is no long-term consequence and the problem has to be seen in the context of cycle ownership and use by 75% of children (Sport England, 2003) – some 6 million children in England. When injury does occur, cyclists are only slightly more likely to suffer head injury than the average for all activities and significantly less than pedestrians. There is no basis for the perception that cycling is an activity that is especially productive of head injuries.
Moreover, our estimates are very much theoretical upper limits to the ability of cycle helmets to mitigate serious head injuries. Of the children whose injuries are covered by this analysis, an unknown proportion were wearing helmets. Helmet manufacturers are careful to state that their products are no guarantee of effective protection, and independent tests have shown that many helmets do not meet the standards to which they are accredited (Which, 1998), the most common of which is the equivalent of a fall from a stationary or slow-moving bicycle (BSI, 1997). Furthermore concern has been expressed that the most serious types of head injury, that lead to death or long-term disablement, involve rotational acceleration which cycle helmets do not reduce, and under some circumstances might make more likely (Curnow, 2003).
This caution is reinforced by a comparison of adult and child cyclist head injuries from 1995 to 2001 (Cook and Sheikh, 2003). The proportion of adult admissions involving head injury fell by less than that for children (8.09% v 8.32%). However, whilst adult helmet use increased by over 50% during the period and in absolute terms was much greater, child helmet use was static. The real-world potential for helmets to provide significant protection against head injuries would appear to be small.
Whole-life risk
The number of children who suffer head injuries when cycling is small relative to cycle use and tiny compared with other threats to child health and life expectancy. In 2001 over 1.2 million children in the UK were obese and the number is expected to rise to 3 million by 2020 (RCP, 2004). Obesity shortens lives by an average of 9 years (HoCPAC, 2002) as well as causing much suffering during childhood and beyond. Boosting cycling by children has been described as potentially the most effective single measure to tackle the obesity epidemic (HoCHC, 2004).
It is important to us to keep sight of this larger picture, and not to over-react to the relatively small, if important, issue of child cyclist head injury in a way that is counter-productive to children's overall health and well-being. Cycle helmet promotion is strongly associated with reductions in cycle use and the perception of cycling as an unsafe activity (Bryan-Brown and Taylor, 1997). Given the large dissimilarity in risk, it would require only a small number of children to lead more sedentary lifestyles as a consequence of not cycling for there to be a net health disadvantage.
Cycling is the second most popular and frequently undertaken form of physical exercise engaged in by children out of school (Sport England, 2003), and because of this small changes in cycle use have profound consequences for the overall fitness of children. Since 1994, when cycling was the source of exercise most frequently enjoyed by children, there has been a fall of 5% in the number of children who cycle, and a fall of 8% in those who do so frequently. For many children the loss of cycling has not been replaced by comparable forms of physical activity, and the reduction in cycle use is likely to have been a key factor leading to the rise in childhood obesity.
The risk of head injury when cycling is declining, both in absolute terms and also relative to many other activities. This change cannot be attributed to the use of cycle helmets, as overall helmet use remained static over the survey period and declined among the group of boys most at risk. In part the reduction in risk mirrors similar reductions for other road transport groups, a possible consequence of road safety initiatives, such as traffic calming and speed awareness campaigns. This is consistent with a review of measures to reduce cyclist casualties, in which developments in training and engineering were accredited with the potential to reduce casualties by 27%, of which cycle helmets would make less than 1% difference (Downing, 1985).
Conclusions
We find no basis for the idea that cycling is dangerous or especially productive of head injuries. Our study has shown that the greatest influence on the likelihood of serious head injury is motor vehicle involvement, independent of whether a child is cycling, walking or a car passenger. We conclude that improving the safety of the cycling environment is likely to be more effective in reducing head injuries than the promotion of helmets, and it would also benefit child pedestrians who outnumber cyclists 5 to 1 in receiving head injuries. Increasing walking and cycling to gain the wider health benefits is complementary to this, for it has been shown to be the most effective way to reduce the risk of all kinds of injury to those involved (Jacobsen, 2003).
References
Bryan-Brown and Taylor, 1997
Bryan-Brown K, Taylor S, 1997. Cycle helmet wearing in 1996. Transport Research Laboratory Report 286.
BSI, 1997
Helmets for pedal cyclists and for users of skateboards and roller skates. British Standards Institute, London BS EN 1078 1997.1997.
Cook and Sheikh, 2003
Cook A, Sheikh A, 2003. Trends in serious head injuries among English cyclists and pedestrians. Injury Prevention 2003;9:266-267. 
Curnow, 2003
Curnow WJ, 2003. The efficacy of bicycle helmets against brain injury. Accident Analysis and Prevention 2003,35:287-292.
DETR, 1996
Cycling in Great Britain. Department for the Environment, Transport & Regions .1996.
Downing, 1985
Downing CS, 1985. Pedal cycle accidents in Great Britain. Ways to Safer Cycling conference .
Gregory, Inwood and Sexton, 2003
Gregory K, Inwood C, Sexton B, 2003. Cycle helmet wearing in 2002. Transport Research Laboratory Report 578. 
HoCHC, 2004
Obesity. Third report of House of Commons Health Committee. May 2004.
HoCPAC, 2002
Report of House of Commons Public Accounts Committee. January 2002.
Jacobsen, 2003
Jacobsen PL, 2003. Safety in numbers: more walkers and bicyclists, safer walking and bicycling. Injury Prevention 2003;9:205-209.
Jenkins, 2003
Parliamentary Question by Brian Jenkins MP, answered by Dr Ladyman, Department of Health. Hansard Written Answers, page 17-8W, 10 November 2003.
RCP, 2004
Storing up problems - The medical case for a slimmer nation. Royal College of Physicians ISBN: 9781860162008 .2004.
Sport England, 2003
Young people and sport in England. Sport England, 2003.
Which, 1998
Get a head start. Which? October 1998 pp 28-31.