
Comments on Road Safety Research Report 30 (RSRR30) by Towner et al
Road Safety Research Report No 30
Towner, Dowswell, Burkes, Dickinson & Hayes. Department for Transport, London, November 2002.
Original report 
Introduction
This independent review of the report by Towner et al has been written by Dorothy Robinson.
See also:
Summary
RRR30 states, as background to the Project Brief: "there is a wealth of published evidence both for and against promotion and compulsory use of bicycle helmets, and DfT requires an independent objective critique of the most up-to-date evidence on the efficacy of bicycle helmets. It is also important to have up-to-date information on legislative measures internationally and their impact on bicycling activity levels and safety." The stated aims were 1) to critically review the literature, 2) consider how and where bicycle helmets are worn compulsorily and the impact of this on cycling and safety and 3) to identify gaps in existing knowledge and research.
RSRR30's literature review contains considerable detail on bicycle helmet standards and case-control studies of helmet efficacy. The latter generally show that cyclists who choose to wear a helmet have a lower proportion of head to non-head injuries than non-wearers. This may be due to the protection of helmets, or perhaps because of differences in riding habits and attitudes to risk in the two groups. So far, most bicycle helmet case-control studies have adjusted for factors such as age, sex, motor vehicle involvement, and sometimes, time of year, crash surface or amount of damage to the bicycle. These serve as proxies for what really determines the risk of head injury, including impact speed, ability of the rider to avoid a head impact in a fall, and nature of the accident. In bike only crashes, riders skidding on pavement may have vastly different risks of head injury to those going over the handlebars after hitting a pothole at speed. In bike/motor vehicle crashes, riders sideswiped by a left turning car probably have different risks to those riding quickly along a major road until forced to career headlong into a rightturning vehicle turning. It would be difficult, if not impossible, for a case-control study to adjust for such differences. Thus, if there are differences in the type of accidents experienced by wearers and non-wearers, these differences will be falsely attributed to the effect of helmets.
Because of these limitations, estimates of helmet efficacy should not be derived solely from case-control studies. Other measures are also needed, such as changes in head injury rates following helmet laws which increased wearing rates in Australia from 26% - 38% pre-law to 75% - 85% post-law. It has generally been observed (see section 3.2) that increases in wearing rates following legislation don't produce head injury reductions consistent with the predictions from case-control studies. This suggests that the predictions from case-control studies are incorrect. As well as the problems noted above, other real-life factors such as risk compensation may be counteracting any benefits of helmet wearing.
Given the limitations noted above, and that other reviews of case-control studies have already been published, there seems little point in discussing them further. It is therefore in relation to helmet promotion and legislation that RSRR30 should have expended the greatest effort in critically reviewing available research and identifying gaps in existing knowledge, in order to satisfy the project brief. Notable by its omission from RSRR30's summaries of studies into helmet promotion is TRL Report 286, which found that helmet promotion campaigns were strongly linked to a decrease in numbers of cyclists observed. Most of RSRR30's summarized studies simply claim that helmet promotion increases helmet wearing. Unless this also leads to reductions in the risk of head injury (as discussed in Section 4 there is as yet no credible evidence for this), the goal is, in itself, pointless. Rather than state the obvious (that promoting helmets increases wearing rates) RSRR30 should have noted the lack of knowledge concerning the effect of helmet promotion on cycle use, rates of head injury, risk of accidents and cyclists' perception of helmet efficacy and risk. A major recommendation should therefore be that any future studies of helmet promotion be designed to investigate the effects all four.
RSRR30's summary of helmet legislation is also inadequate. There are many published studies showing significant reductions in cycling with legislation. Most of these aren't even mentioned by RSRR30! The reported consequences of legislation in Victoria, Australia are so badly misrepresented that one wonders if the authors actually read, let alone critically reviewed, all relevant information in the cited documents. RSRR30, for example, claims that there was a marginal increase in adult cycle use, yet the surveys reported in that document actually show 29% fewer adults at the same sites, observation periods and time of year. Some reasons for the confusion are discussed in section 3.1, which attempts to paint a more accurate picture of Victoria's helmet law than RSRR30. Given the obvious confusion over consequences of helmet laws, RSRR30 should also have listed this as an important gap in our knowledge. Also lacking are summaries of cost-benefit analyses of helmet laws (such as Hendrie, Legge, Rosman and Kirov, 1999; Taylor and Scuffham, 2002). Both suggested the costs of helmet wearing are greater than the benefits. Cost-benefit analyses are a vitally important aspect of policy formulation, enabling helmet use to be compared with other road safety measures such as enforcement of speed limits and drink-driving laws. It is incredible that RSRR30 fails to discuss costs and benefits.
Noted also that the most feared head injuries are those involving death or intellectual disablement. The efficacy of helmets to prevent such injuries is still debatable. Curnow, 2003 argued that diffuse axonal injury (DAI) causes the majority of intellectually disabling head injuries and that helmet wearing may even increase the risk of DAI. RSRR30 should have noted this important gap in our knowledge, and recommended further research to improve the situation.
Helmet legislation
Unwin 1996 listed four criteria to be met before bicycle helmet wearing should be enforced. These criteria are an excellent starting point for discussion. Their only real drawback is that they deal with the issue of helmet laws in isolation. The vast majority of fatalities and the most serious injuries to cyclists result from collisions with motor vehicles. Cyclists cannot therefore be considered as isolated road users. Legislation for cyclists must be discussed in the context of the transport system as a whole, and legislation affecting other road users. In particular,
5) Cyclists should not be singled-out for helmet legislation if similar legislation for other road users such as motor vehicle occupants would achieve equally beneficial reductions in head injury.
6) The costs-benefit ratio for helmet legislation (including any lost health or environmental benefits from reduced cycling and the cost of alternative transport) should be at least as favourable as cost-benefit ratios for alternative strategies to improve cyclist safety, including educational campaigns to increasing motorist awareness of cyclists, appropriate speed limits, enforcement of drink-driving laws and targetting accident blackspots for cyclists.
RSRR 30 claims that Unwin's Criterion 1 (there must be a high level of scientific evidence that helmets are effective in reducing the rate of head injury) has been demonstrated. However, helmets cannot be considered effective in reducing the rate of head injury if any protection afforded in an accident is offset by increased risk taking leading to a higher accident rate. RSRR30's evidence relates almost exclusively to the protection afforded in the event of a crash. Criterion 1 will be demonstrated only when there is proof that risk compensation does not negate any protection afforded by helmets.
One problem in demonstrating that risk compensation is not an important factor is that different groups may react differently to perceived changes in risk. Cautious cyclists with a low risk tolerance may chose to wear helmets and, being very risk averse, still ride carefully on the roads. In contrast, cyclists with greater tolerance to risk may be only too happy to trade some of the perceived extra protection of helmets for speed and time, e.g. by taking a more direct route in more dangerous traffic instead of using quieter roads. This may be especially true if helmets are strongly promoted in the lead up to a helmet law. In Australia, surveys showed young people actually believed "approved helmets would save their heads and lives in the event of a serious accident (with a bus or truck!)" (Elliot and Shanahan, 1986).
RSRR 30 states that Unwin's Criterion 2 (the benefits to society of mandatory bicycle helmets must be convincingly demonstrated) is less easy to demonstrate (than Criterion 1). Criterion 2 must relate to "a broader debate about the whole bicycling environment: bicycle helmet promotion and legislation needs to be seen as one part of a broader package of measures which enhances bicycling safety." It is certainly true that the debate about helmet legislation and promotion should be conducted within a broader debate about the whole bicycling environment. Information on the cost effectiveness of the different measures is therefore required to identify the most appropriate options from, say, a choice of helmet promotion, traffic calming, identification/remediation of cyclist accident blackspots, or even a package of measures to combat speeding and drink-driving such as that introduced just before the bicycle helmet law in Victoria and estimated to have reduced accident costs by £100 million for a cost of only £2.5 million (Powles and Gifford, 1993).
Two economic evaluations of bicycle helmet laws have been published (Hendrie, Legge, Rosman and Kirov, 1999' Taylor and Scuffham, 2002). Neither suggest that helmet mandation or indeed helmet promotion are cost effective ways of improving safety for cyclists. These findings, based on real-life changes in injury rates when several million cyclists were forced to wear helmets, are so important that the implications should be fully discussed in any review of helmet effectiveness. RSRR30 should therefore have examined the evidence in these documents and compared cost benefit ratios with other ways of improving cyclist safety, such as those suggested above. Comments are also required about how cost-benefit ratios would change if estimates of the costs of reduced cycling activity were included in the costs of helmet mandation. Unwin stated in Criterion 2 that "mandatory bicycle helmet cannot be justified simply to protect individual adult bicyclists." There must be convincing evidence that such laws offer a net benefit to society as large as (and preferably, to compensate for the loss of freedom, larger than) that offered by other road safety measures which could be implemented at similar cost.
RSRR30 continues in relation to Criterion 2 "the experience of countries such as Australia and New Zealand suggests that this process takes time." This appears to suggest that, though the process took time, Criterion 2 has actually been demonstrated in Australia. This implication is not only false and misleading, but utterly absurd! The economic analysis of helmet laws in Western Australia (Hendrie, Legge, Rosman and Kirov, 1999) concluded that the net benefit helmet was probably negative, estimates ranging from +$2 million to -$10 million. Hendrie's evaluation was not able to estimate the net loss to society from reduced cycling activity because of the law. If reduced cycling had been included, the estimated net loss to society from the helmet law would almost certainly have been much greater.
RSRR30's Section 7 (Opinion Pieces) commented that the debate on compulsory helmets is "unhelpful to those wishing to make a balanced judgement on the issue" and "the two sides are often arguing about different issues." In fact most people would agree there is only one real issue: what, if any, is the net benefit to society from compulsory helmets? The best (and perhaps the only) way to answer this question is to carry out a critical and detailed review of the consequences of helmet legislation wherever it has been adopted. In Australia, for example, helmet laws were enacted at different times in different States and there is a wealth of evidence concerning its effect on the amount of cycling, including census data on cycling to work, surveys asking riders if the law had affected the amount they cycled, as well as pre- and post law street counts of cyclists in several States. Time series information on head injuries to cyclists and pedestrians is also available for several States.
The Debate continues because the available information has never been collated into a full and comprehensive evaluation of helmet laws. The effect on numbers of cyclists can be evaluated using the datasets noted above. Concerns about risk compensation can be evaluated by comparing the rate of hospitalizations or other injuries relative to the amount of pre-law cycling with the same data collected post-law. Robinson (1996) noted there were common (and remarkably similar) trends in percentages with head injury affecting all road users. Recent evaluations (e.g. Hendrie, Legge, Rosman and Kirov, 1999) have attempted to allow for this effect by comparing the recorded percentage of cyclists with head injury to the same statistic for other road users. Earlier evaluations were less sophisticated and so open to question because of obvious confounding between trends and the effects of the law. Another evaluation (Carr, Dyte and Cameron, 1995) was also problematic because it analyzed numbers of head injuries (rather than percentages with head injury) making it impossible to distinguish between reductions due to reduced cycling and those due to increased helmet wearing. RSRR30's case study of helmet legislation in Victoria is therefore reviewed here.
Case Study – Legislation in Victoria, Australia
RSRR30's summary of helmet legislation in Victoria was based on early studies such as that of Cameron, Vulcan, Finch and Newstead, 1994 who mistook trends common to all road users for effects of the helmet law. Cameron, Vulcan, Finch and Newstead, 1994 reported an estimated fall of 44% in teenage cycling. At the same sites, time of year and observation periods 29% fewer adult cyclists were also counted. Astonishingly, the latter was interpreted as a 44% increase in adult cycle use! The data underlying this bizarre claim are discussed. The validity of RSRR30's comments on the effects of legislation in Victoria (p44) is also examined here, in the light of other published and readily available evidence.
Effect on participation rates
The 44% decline in teenage cycling exposure for Melbourne, Australia, was derived from well-designed surveys in May 1990 (pre-law), May 1991 (post-law) and May 1992 (Finch, Heiman and Neiger, 1993). The surveys used the same methodology as a much earlier survey at a different time of year (Dec/Jan 1987/88). All used the same 64 sites and observation periods, and, when possible, the same observers. Weather was recorded – 82% of sites had same weather classification in 1990 and 1991. Number of cyclists passing through marked 75 metre areas were recorded for each site, as well as the time taken to ride through the area.
|
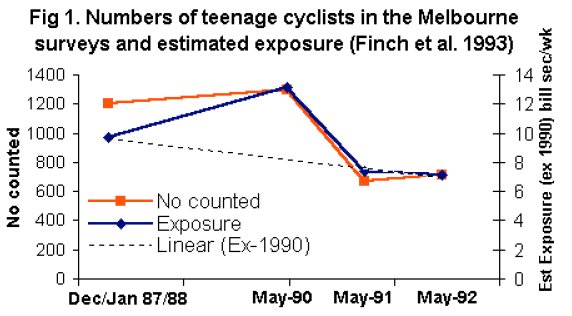 |
Compared with the pre-law survey (1990), counts of teenage cyclists fell by 48% and teenage exposure (estimated by total time taken to ride through the marked areas) fell by 44% (Finch, Heiman and Neiger, 1993). The data, reproduced graphically in Fig. 1, show that estimated exposure was highly correlated with numbers counted. This is expected; in surveys a year apart, average time to ride though the same marked areas is unlikely to vary substantially. The same was also true for children; counts fell by 10%, compared to an estimated decline of 3% in exposure.
|
Adult cyclists were counted and timed in all surveys except 1990, when they were counted but not timed. Given this limitation, what is the best estimate of the change in adult cycle use? For child and teenage cyclists, the change in numbers counted was a reasonable estimate of the change in exposure. The same should therefore be true for adults. Indeed, because sites were a fixed length, numbers counted could be interpreted as an estimate of distance cycled, an equally valid measure of cycle use as time spent cycling. Numbers of adults counted fell by 29% (Table 1).
|
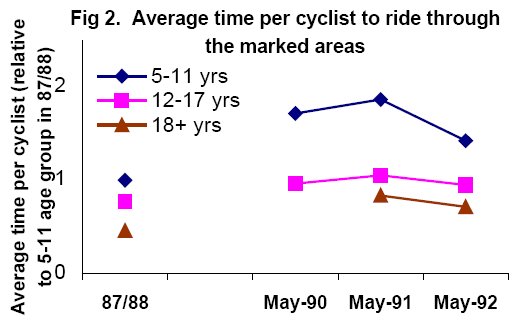 |
Alternatively, adult exposure could be estimated by predicting the average time to ride through the marked areas in 1990 using data from the other surveys. Average times (relative to the 5-11 age group in 1987/88) are shown in Fig 2. Adults rode faster on average than children or teenagers, but all surveys in May showed a fairly similar pattern, from which it would be relatively easy to predict an average time for adults in 1990 and hence adult exposure. For example, teenagers were 8% slower in 1991 than 1990, as were child cyclists. If this were also true for adults, the estimated change following legislation would be a 24% decline in adult exposure.
Fig 2 also shows that the Dec/Jan 1987/88 survey was very different to the surveys in May. Average cycling times in Dec/Jan 87/88 were substantially faster, so it would be very unwise to extrapolate exposure data from the Dec/Jan survey to those in May. Fig 1 demonstrates this very clearly by a linear extrapolation of teenage exposure for May 1990 from estimated exposure in the other surveys. The resulting estimate is essentially useless as a predictor of teenage exposure in 1990 – much worse than estimates based on changes in numbers counted, so that it could not be recommended as a valid statistical technique. It is therefore very strange that Cameron, Vulcan, Finch and Newstead, 1994 used this technique to claim the helmet law resulted in "an estimated 44% increase in adult cycle use". Use of the methods discussed earlier, demonstrably superior for estimating teenage exposure in the same circumstances, would have led to estimates of a 29-24% decline in adult exposure.
Cameron, Vulcan, Finch and Newstead, 1994 also claim (Fig. 7 of their paper) that total cycle use in Melbourne in Dec/Jan 87/88 was about 55 million hours per week. They report Melbourne's population as about 3 million, leading to the incredible conclusion that in 1987/88 each man, woman and child in Melbourne spent an average of 18.3 hours cycling per week! We can only speculate as to how this very strange estimate was derived. A couple of years earlier, INSTAT (Day to Day Travel in Australia 1985-86) came up with a more conventional estimate of 19.7 minutes per week for males and 4.8 minutes for females in Melbourne.
Section 7 (Opinion Pieces) of RSRR30 disparages as "selective reporting" a comment on Australian website that the BMA is against helmet laws, because it fails to mention that the BMA also recommended that cyclists should wear helmets. RSRR30 could perhaps be accused of similar selectivity, having claimed that the surveys in Melbourne (summarized above from information published by Finch, Heiman and Neiger, 1993) show that "estimated adult bicycling exposure increased marginally." At the very least, RSRR30 should have mentioned this estimate was based on surveys in May 1990 and May 1991 in which the 29% fewer adults were counted at the same sites and observation times. Moreover, that other methods of estimating exposure, such as those described in the previous two paragraphs and which avoid the problems of comparing surveys as different times of year, indicate a decline of 24-29% in adult cycling.
RSRR30 also notes that the most common argument against helmet laws is that they lead to a reduction in cycling. It was therefore disappointing to see that many counts and surveys before and after the helmet laws in Australia were not even cited, let alone discussed. Robinson, 1996 summarized counts of child cyclists in New South Wales (NSW) at the same sites, observation periods and times of year, as well as results of interviewing residents of the Australian Capital Territory, the Northern Territory and Western Australia. Long-term data series such as the proportion of the population cycling to work is also relevant, because at the time of the 1991 census some States had enforced laws and others did not. On average, the proportion cycling to work increased from the previous census in States without enforced laws, whereas on average, cycling to work decreased in States with enforced helmet laws.
RSRR30 claims (Section 9, perhaps referring to the Australian experience) that "Barriers to helmet use can be overcome". However, two of the most comprehensive surveys in Australia using the same sites and observation periods as the same time of year, summarized in Table 1, clearly show that the increase in numbers wearing helmets was in both cases substantially less than the decrease in numbers counted. In Victoria, 1110 fewer cyclists were counted, but only 297 more cyclists were observed wearing helmets (see Table 1). In New South Wales 2215 fewer child cyclists were counted, with only 1019 more cyclists observed wearing helmets (Robinson, 1996). This strongly suggests that in Australia the barriers to helmet wearing were not overcome and that the main effect of the law was to discourage cycling.
Effect of Victoria's helmet law on head injuries
Hospital admissions with any head injury (including wounds to the head)
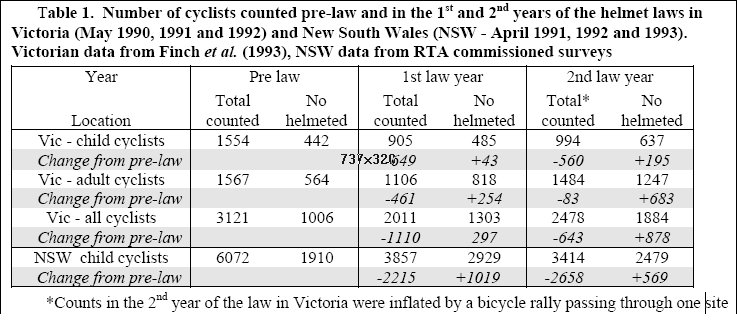
Fig 3 shows hospital admissions of cyclists for head and other injuries in Victoria in the years before and after the helmet law (from Carr, Dyte and Cameron, 1995). Cameron, Vulcan, Finch and Newstead, 1994 classified head injury cases as any admission with a head injury, included wounds to the scalp, ears or wounds to the head, whether or not this was the reason for admission to hospital. It is believed Carr, Dyte and Cameron, 1995 did the same.
There is no doubt that wearing a helmet reduces the incidence of head wounds, and these data suggest there was some reduction in the percentage of cyclists classified as head injured according to this definition. However, the reduction is modest and it is quite difficult to tell which line in which. Non-head injury admissions (right hand axis) outnumbered those for head injury by a factor of approximately 2:1, both before and after the law. The most striking effect of the law appears to be a substantial reduction in both head and non-head injuries, consistent with the survey data suggesting that the main effect of the law was a reduction in cycling.
Another striking effect of Fig 2 is the marked seasonal variation. Though numbers of injuries are not necessarily a reliable indicator of the amount of cycling, the data strongly suggest that there is substantial seasonal variation in cycle use. This supports the observation that estimates of the effect of the helmet law on cycle use should not be based on surveys conducted at different times of year. The alternative of estimating the average time for adults to ride through the marked areas, and multiplying this by the number of adults counted, should therefore provide a much more reliable estimate of the effect of legislation.
Road accident cases with head injury or concussion as the most serious injury
Robinson, 1996 presented data provided by the Victorian Transport Commission (TAC) on pedestrians and cyclists on injuries to cyclists following bike/motor vehicle crashes. Unlike the analysis of Cameron, Vulcan, Finch and Newstead, 1994 and Carr, Dyte and Cameron, 1995, these data used TAC's classification system, based on the most serious injury. Head injured cases were those receiving treatment for skull fracture, concussion or other brain injury. The highest incidence of head injury was in child pedestrians. This group also showed the greatest reduction with the helmet law, declining from 18.3% of claims in the year before the law to 10.7% in the two years post-law (Robinson, 1996). The reduction for child cyclists was much more modest, despite the fact that, unlike their pedestrian counterparts, they were required to wear helmets. Robinson, 1996 discusses reasons for the reductions in head injury of all road users, including a major road safety initiative directed at drink-driving and speeding introduced in December 1989 and March 1990, only a few months before the helmet law. Pedestrian fatalities fell from by 42% from 159 in 1989 to 92 the following year. This initiative was estimated to have reduced accident costs by £100 million for a cost of £2.5 million (Powles and Gifford, 1993).
Fatalities and brain injuries, excluding concussion
In addition to reductions in head injury due to the road safety campaigns, a possible explanation for some of the trends in both pedestrian and cyclist head injury data was suggested by Marshall and White, 1994. They cited No of head injuries 0 10 20 30 40 50 60 87 88 89 90 91 92 93 94 0 20 40 60 80 100 120 140 No of non-head injures Start of helmet law <31% helmeted approx 75% helmeted Laurie (1992): "it is understood that, since helmet wearing became compulsory, the procedure for patients with a short episode of concussion has changed in that such patients are not now admitted routinely." A comparison of deaths and serious brain injuries excluding concussion might therefore be a more useful way to evaluate the effect of the helmet law. Table 2 shows numbers of cyclist deaths and serious head injuries (DSHI) based on the classification provided by TAC (skull fractures – IDC9 codes 800, 801, 803, 804 plus other brain injuries 851- 854), as well and other serious injury (OSI – essentially those requiring admission to hospital, see Appendix). Pedestrian injuries were classified in the same way.
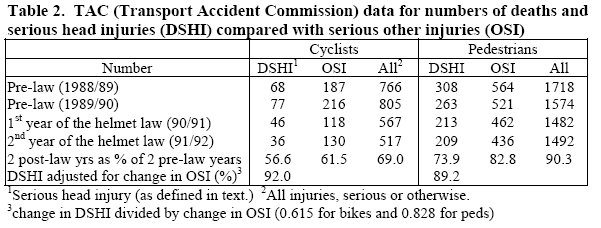
Comparing the 2 years before legislation with the two post-law years, Table 2 shows that DSHI to cyclists fell by 43%, OSI fell by 38% and all injuries (serious or otherwise) by 31%. For pedestrians, DSHI fell by 26%, OSI by 17% and all injuries by 10%. Both groups experienced a reduction in injuries and, more importantly, a reduction in injury severity. In both groups, DSHI fell by slightly more than OSI (Table 2). However, after adjusting for the fall in OSI, the fall in DSHI for cyclists was actually less than that for pedestrians. Thus there is no evidence that the increased helmet wearing had any effect on numbers of cyclists suffering DSHI. Indeed, allowing for the 36% fall in numbers of cyclists counted in observational surveys (discussed in 3.1), injury rates per cyclist appear to have increased relative to those for pedestrians. It could therefore be argued that, if trends in cyclist injuries normally follow those for pedestrians, the risk of death and serious head injury to cyclists was actually higher than it would have been without the law.
Cameron, Vulcan, Finch and Newstead, 1994 published an analysis of the same accident data, stating that, relative to the year before the law, head injuries to cyclists fell by 48% and 70%, compared to 23% and 28% for non-head injuries. This is a dramatically different interpretation of the same data as that presented above. However, Cameron, Vulcan, Finch and Newstead, 1994 classified head injury cases as any admission with a head injury, included wounds to the head, scalp or ears whether or not this was the reason for admission to hospital. We may therefore conclude that the helmet law had an effect in reducing minor injuries such as wounds to the head, but no discernible effect on more serious head and brain injuries listed here. This is discussed in more detail in the Appendix, which examines a longer sequence of data and discusses the variation in head injury rates with age, noted by Robinson, 1996.
Fatalities
The major road safety initiatives introduced in Victoria a few months before the helmet law had a dramatic effect on fatalities to pedestrians. It is therefore of interest to compare pre- and post-law fatality data for pedestrians and cyclists. To reduce the effect of year to year fluctuations, numbers of cyclists and pedestrians killed on the roads were tabulated for 3 years before the law (1987-90) and three years afterwards (1991- 93). The published data were for calendar years, so (because the law was introduced mid year - 1 July 1990), it was not possible to include 1990 in the comparison.
|
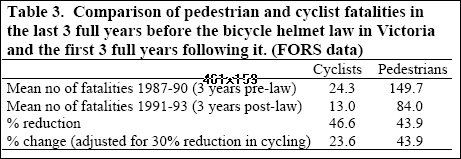 |
Table 3 shows that, compared to the three pre-law years, cyclist fatalities fell by 46.6%; pedestrian fatalities by 43.9%. So, despite the protection of helmets and the substantial drop in numbers of cyclists counted (section 3.1), fatalities to cyclists fell little more than those to pedestrians. Without the law, cyclist fatalities might have been expected to follow the same trend as pedestrians, falling by perhaps 44%. Added to the 36% decline in numbers counted (section 3.1), a total fall of about 64% might have been expected. The actual figure of 46.6% is therefore very disappointing, suggesting that, far from protecting cyclists, the risk per cyclist of dying on the roads may have increased compared to what it would have been without the law.
Helmet promotion
After reviewing more than 100 research reports Hillman, 1993 concluded that : "The weight of evidence is Table 3. Comparison of pedestrian and cyclist fatalities in the last 3 full years before the bicycle helmet law in Victoria and the first 3 full years following it. (FORS data) Cyclists Pedestrians Mean no of fatalities 1987-90 (3 years pre-law) 24.3 149.7 Mean no of fatalities 1991-93 (3 years post-law) 13.0 84.0 % reduction 46.6 43.9 % change (adjusted for 30% reduction in cycling) 23.6 43.9 Table 2. TAC (Transport Accident Commission) data for numbers of deaths and serious head injuries (DSHI) compared with serious other injuries (OSI) Cyclists Pedestrians Number DSHI1 OSI All2 DSHI OSI All Pre-law (1988/89) 68 187 766 308 564 1718 Pre-law (1989/90) 77 216 805 263 521 1574 1st year of the helmet law (90/91) 46 118 567 213 462 1482 2nd year of the helmet law (91/92) 36 130 517 209 436 1492 2 post-law yrs as % of 2 pre-law years 56.6 61.5 69.0 73.9 82.8 90.3 DSHI adjusted for change in OSI (%)3 92.0 89.2 1Serious head injury (as defined in text.) 2All injuries, serious or otherwise. 3change in DSHI divided by change in OSI (0.615 for bikes and 0.828 for peds) against the encouragement of cyclists to wear helmets." This judgement was based on the possibility of increased accidents due to risk compensation and that: "Cycle helmets are a means of slightly reducing head injury if an accident occurs. Wearing a helmet does nothing to prevent accidents. The primary means of reducing serious head injury among cyclists is to create an environment in which accidents are less likely to happen."
Cyclists' organizations such as the CTC have expressed skepticism about the value of helmet promotion. A document on the CTC's website states: "The effect of awareness-raising programmes to encourage the public to use safety equipment such as helmets reinforces the notion that cycling is a hazardous, rather than an everyday, activity. The Transport Research Laboratory’s investigation into helmet wearing found that, in those local authority areas where an awareness-raising campaign had been held which focussed solely on encouraging helmet-wearing ‘…a larger increase in helmet wearing was found than in the areas which had not held such a campaign. However, this increase was found to be strongly linked to a decrease in the numbers of cyclists observed’ (Bryan-Brown and Taylor, 1997)"
Section 4 of RSRR30 summarizes 19 reports on the effects of helmet promotion. Despite the comments in the TRL report and general concerns expressed by the cycling community, RSRR30 doesn't even mention the possibility that helmet promotion could affect how much people cycle! Like the possibility of risk compensation, this issue should have been addressed by RSRR30. Our current knowledge of the subject may well be inadequate. This does not mean the subject should be ignored. Perhaps the best approach would be to call for further research. RSRR30 should have made strong recommendations that, whenever helmets are promoted, the consequences should be fully investigated. Included should be matched surveys of cycle use, before and after the promotion, at the same sites, observation periods, time of year and if possible, in similar weather. Injury rates should be recorded and related not only to helmet wearing, but injury rates of other road users and the numbers of cyclists observed in the matched surveys. Section 7 "Opinion Pieces" commented that "the way in which the debate has been conduced is unhelpful to those wishing to make a balanced judgement". This comment could, itself, be considered unhelpful. RSRR30 should, instead, have noted the issues of contention and made strong recommendations for further research to improve our inadequate knowledge of these issues.
In fact, RSRR30's summary of 19 investigations into the effects of helmet promotion serves to emphasize the point. 16 of the 19 appear to show simply that promotion of helmets increases helmet wearing rates. This is a somewhat pointless finding, in itself, scarcely worth mentioning. The real goal is to reduce head injury rates, if at all possible, without reducing the amount of cycling. Yet only 3 of the 19 summaries mention either of these two vitally important and relevant issues.
Of these, Ekman, Schelp, Welander and Svanstrom, 1997 found head injuries fell by 59% in the helmet promotion areas compared to a fall of 48% in total injuries. For Sweden as a whole, head injuries fell by 43% vs 32% for total injuries. Thus relative to total injuries, head injuries fell by 1 - (1 - 0.59)/(1 - 0.48) = 21%, compared to 16% in Sweden as a whole, a difference of only 5 percentage points. This would hardly be considered a worthwhile reduction, especially if the amount of cycling was also reduced, a distinct possibility given the much greater fall in total injuries (48%), compared to 32% in Sweden as a whole.
Mock et al, 1995 reported increased helmet wearing and a reduction in head injuries. However, despite the fact that observation studies of helmet wearing rates were carried out, there is no mention of any changes in numbers of cyclists counted, nor whether the surveys before and after helmet promotion used the same sites, observation periods and time of year. If not, why not? The lack of information on cycle use means that no useful conclusions can be drawn for these results. It appears that in 1986, none of the admitted cyclists wore helmets and 29% had severe head injuries (SHI); in 1993, 32% wore helmets and 11% had SHI. Yet even if helmets prevented 100% of SHI (not even remotely likely given the results for Victoria reported in 3.2.3), an increase to 32% helmet wearing cannot be responsible for a 66% fall in the proportion with SHI. Other factors are clearly affecting %SHI, so the results cannot be taken at face value. This work again emphasizes the need for a balanced investigation, weighing up the merits of helmet promotion compared to the other factors obviously influencing the data, instead of obviously incorrect implications that the whole effect can be attributed to helmet wearing.
The only other report mentioning head injury rates was Lee, Mann and Takriti, 2000. The question again arises as to how an increase of 20 percentage points in helmet wearing (from 11% to 31% of all cyclists) can plausibly be responsible for a reduction from 22% to 12% of cyclists visiting A & E Departments having injuries to the head. A previous publication (Lee and Smyth 1996) shows that the percentage of cyclists reporting they always wore a helmet increased from 11% in January 1992 to 21% in Jan 1993 and 32% in Jan 1994. However, the major reduction in head injuries was from the 12 months to May 1992, compared to the following 12 months. The fact that at least part of the decrease in head injuries occurred before the increase in helmet wearing, suggests other important factors should be considered before any reasonable and balanced conclusions can be drawn.
The reviewed research on helmet promotion therefore raises more questions than are answered. The main conclusion should be that any further helmet promotion campaigns should include adequate provision for fully investigating all consequences of the campaign, including using matched observational surveys (at the same sites, observation periods and time of year) to assess possible effects on the amount of cycling. Numbers of injuries to the head, brain and other parts of the body should then be assessed relative to the observed amount of cycling.
Case-Control (observational) studies vs helmet legislation
Section 3 of RSRR30 summarizes the literature on bicycle helmet standards and case-control studies of helmet efficacy. The latter generally show that cyclists who choose to wear a helmet have a lower proportion of head to non-head injuries than non-wearers. This could be due to the protection of helmets, or because of differences in riding habits and attitudes to risk of the two groups.
For example, Maimaris, Summers, Browning and Palmer, 1994 found that 58% of head injured adult cyclists had collided with a motor vehicle. However, the risk of head injury depends not only on whether a motor vehicle was involved, but impact speed. McGuire and Smith 2000 reported that helmet wearers were more likely to wear high visibility clothing (28% of wearers vs 3.5% of non-wearers) and use lights and night. Hillman (1993) commented: "The proposition that cycling is relatively dangerous overlooks the fact that few cyclists ride into motor vehicles. The great majority of serious injuries or deaths result from being hit by a carelessly driven motor vehicle." Use of high visibility clothing may often not be enough to prevent a collision, if the driver is not expecting to see a cyclist. However, it may help the driver initiate braking before impact, reducing collision speed and hence the risk of head injury. Helmet wearers may also chose to travel on quieter roads with slower moving traffic, again resulting in lower impact speeds in the event of a bike/vehicle collision. Any such differences in impact speed of collisions for wearers vs non-wearers are likely to affect the risk of head injury, but be falsely attributed to helmet wearing in the analysis of Maimaris, Summers, Browning and Palmer, 1994.
So far, most bicycle helmet case-control studies have adjusted for used factors such as age, sex, motor vehicle involvement, and sometimes, time of year, crash surface, or amount of damage to the bicycle. These serve as proxies for what really determines the risk of head injury, including impact speed, ability of the rider to avoid a head impact in a fall, and nature of the accident. It would be hard to imagine that riders hitting their heads after skidding on pavement have similar risks of head injury to those going over the handlebars after hitting a pothole at speed. Similarly, the risks are almost certainly different for riders sideswiped by a left turning car, compared to those riding quickly along a major road forced to career headlong into a vehicle turning right straight in front of the cyclist's path. It would be difficult, if not impossible, for a case-control study to adjust for such differences. Thus, if there are differences in the type of accidents experienced by wearers and non-wearers, these differences will be falsely attributed to the effect of helmets.
Because of these limitations, it is important that estimates of helmet efficacy are not derived solely from casecontrol studies. Other measures, such as changes in head injury rates following helmet laws which, at least in Australia, increased wearing rates from 26% - 38% pre-law to 75% - 85% post-law. If, as has been found (see e.g. section 3.2 for Victoria) such increases in wearing rates don't produce reductions in head injury consistent with the predictions from case-control studies, it seems likely that the predictions from case-control studies are incorrect, because of the problems noted above, or other real-life factors such as risk compensation.
It should be also noted that the most feared head injuries are those involving death or intellectual disablement. The efficacy of helmets to prevent such injuries is questionable. Curnow, 2003 argued that diffuse axonal injury (DAI) causes the majority of intellectually disabling head injuries and that helmet wearing may even increase the risk of DAI. For Victoria, section 3.2.3 showed that, though the helmet law probably reduced wounds to the head, there was no reduction in serious head injuries. A case-control study covering pre- and post-law data (McDermott, Lane, Brazenore and Debney, 1993) found that 28.6% of cyclists aged at least 18 years and who were wearing an approved helmet had head injuries, compared to 38% of non-wearers. Promotion campaigns claiming helmets prevent 88% (or even 67%) of head/brain injuries may do more harm than good by lulling wearers into a false sense of security. If 28.6% of wearers were head injured and helmets really prevented 67% (88%) of head injuries, 87% (238%) of non wearers should have been head injured. The magnitude of the discrepancy between the prediction and reality illustrates only too well that cyclists should not be given an exaggerated belief in the efficacy of helmets. As McDermott's data show, a substantial proportion of helmet wearers still suffer head injury. It is undoubtedly far better to take care and avoid a crash in the first place than take any unnecessary risks, mistakenly believing that, if the worst comes to the worst, helmets prevent the vast majority of head injuries.
Appendix A. Comments and criticisms of specific issues raised in RSRR30.
Section 3 - Observational Studies
Design 1 is a valid estimate of the efficacy of helmets only if wearers and non-wearers are equally likely to sustain head impacts. This is almost certainly false. Many falls result in arm and shoulder impacts to the ground, with an non-helmeted head missing the ground by perhaps a couple of inches. This distance is comparable to the thickness of a helmet and almost certainly means that many in many crashes where a bare head will not touch the ground, a helmet will.
Few studies have investigated this effect. However, a study in Vermont (Wasserman et al, 1988) interviewed cyclists at roadside stations and observed only 40/516 (7.8%) wearing helmets. Yet when it came to reporting hitting their heads in the past 18 months, this had happened to 8 cyclists wearing a helmet compared to only 13 without. Assuming the observed helmet wearing was typical of the cyclists' regular habits, head injury rates in helmeted and non helmeted cyclists (7/476 vs 0/40) were therefore not significantly different (P>0.55), but the incidence of hitting their heads in a cycling accident was most significantly higher for helmet wearers (8/40 vs 13/476 i.e. 20% vs 2.7%; P < 0.00001).
Appendix B. Supplementary Information on pre- and post-law injuries to cyclists in Victoria
Analysis of trends
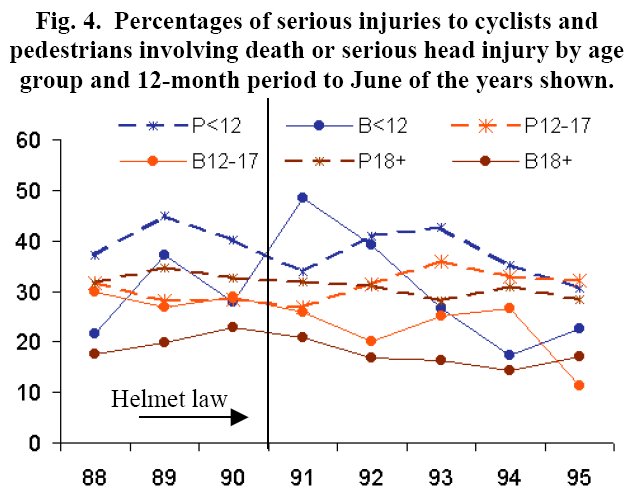
The tabulation of numbers of deaths and serious head injury and other serious injury in Table 2 shows the immediate effects of the helmet law. Any longer-term analysis may need to take account of trends in the data. Fig. 4 shows the percentage of serious injuries to cyclists and pedestrians involving death or serious head injury (%DSHI), before and after the helmet law (vertical line) in Victoria. Robinson, 1996 reported head injuries as a percentage of total injuries and noted that children had the highest percentage, followed by teenagers and then adults and also that that the percentage was higher for pedestrians than cyclists. Fig. 4 shows that the same applies to DSHI expressed as a percentage of all serious injuries.
In addition, there appear to be some general trends, such as the increase from 1988 to 1989, but they are less pronounced than the analysis of Robinson, 1996, where cases of concussions were included in the head injury total. As noted in 3.2.3, admission procedures for concussions may have changed, making it more difficult to make sense of time series relating to head injury including concussions.
|
 |
|
Other aspect of the data are shown in Fig. 5, including the percentages of total serious injuries by age group (18+ years, 12-17 years and under 12s). In 1988, teenagers suffered nearly half of all serious injuries to cyclists, falling steadily to 27% in 1995. The same statistic for children also exhibited a slight downward trend. Conversely, serious injuries to adults increased from about 30% of total serious injuries to nearly 60% in 1993-95.
Table 1 shows that the decline in numbers of teenage cyclists following the helmet law was greater than that for children or adults. The most plausible explanation for the fall in injuries to teenage cyclists relative to those for adults is therefore a greater decline in teenage cycling since the law. As numbers have declined, the graph of %DSI in Fig. 4 becomes somewhat more erratic due to sampling variation.
|
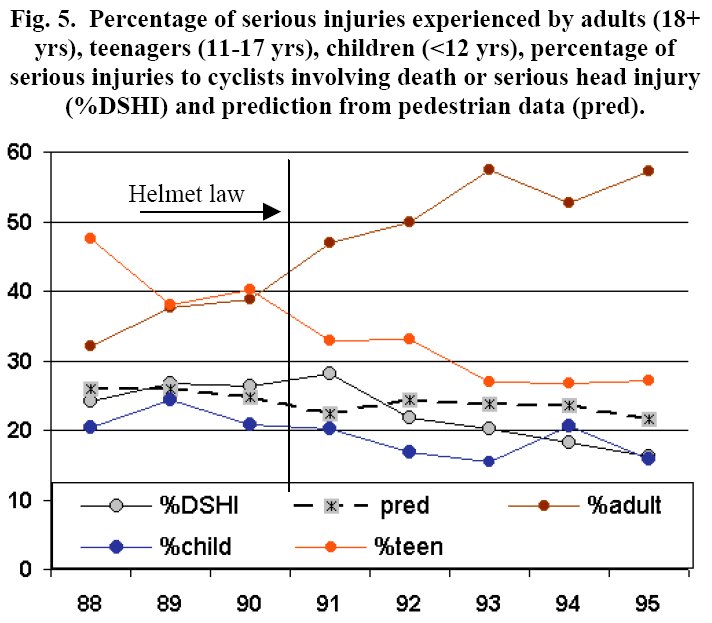 |
Adults have proportionally fewer serious head injuries (as percent of total serious injuries to adults), so as adults form an increasingly greater proportion of total injuries, a gradual decline in %DSI would be expected. However, Fig. 5 shows that, after increasing in the first year of the law, %DSHI also appears to be reducing relative to what might be predicted from information on age and %DSI for pedestrians. Could this be a delayed effect of the law, or is it just a trend due to other factors? The helmet law in Victoria was strongly enforced from the beginning. Sullivan 1990 reported that in July, only a few weeks the law came into effect, 94% of primary and 87% of secondary school cyclists were wearing helmets, as were 89% of adult commuters. Fig. 3 shows an immediate and dramatic effect of the law in hospital admissions, including non-head injured cyclists. Thus the law had an immediate effect on helmet wearing rates and hospital admissions, the latter being a possible indicator of the total amount of cycling. There is therefore no plausible reason why the effect on %DSHI would not be equally dramatic. The gradual decline in %DSHI would therefore appear to just that – a gradual trend probably unrelated to the increased helmet wearing due to legislation.
Factors relating to the changing composition of cycling following the law could cause gradual trends. Teenagers deterred from cycling because of the law may be less likely to ride as adults. Thus the 44% reduction in cycling of 12-17 year olds following the law may, after 5 years, lead to a reduction in cycling by 17-22 year olds. Simple tabulations based on broad categorization of %DSHI by age group may not be able to fully account for such changes, which would therefore appear as gradual trends. The immediate effect of the law shown in Fig 5 was the very small increase in %DSHI from 1990 to 1991. Quite possibly that small change is a better reflection of the real effect of increased helmet wearing due to the law than the gradual decline over the following years.
Other researchers, e.g. Scuffham, Alsop, Cryer and Langley, 2000, modelled the effect of increased helmet wearing in NZ with and without fitting trends. They commented: "we noted that the addition of a time trend component caused the helmet wearing proportion to become insignificant. That is, a time trend variable 'swamped' the real effect." This, of course, leaves their results somewhat open to question.
However, even accepting the estimated benefits of the helmet law at face value, the follow-up economic analysis of Taylor and Scuffham, 2002 showed that the law was not cost effective for adult or teenage cyclists. For children 5-12 years, the effect of the law was relatively minor because 87% of cyclists in this age group wore helmets before the legislation. For all 5-12 year olds in the whole country, the law was estimated to prevent an average of 4 head injuries per year, each averaging 2.8 hospital bed days (11.2 bed days per year). Estimated total saving in healthcare costs for 5-12 year olds was $5,577. This was achieved at a cost of $180,792 for purchase of additional helmets.
Taylor and Scuffham, 2002 considered the above to be cost effective for 5-12 year old on the basis of a "willingness to pay" survey for avoiding injury requiring short stay hospital treatment less than seven days, and long stay hospital treatment of seven or more days. The vast majority of benefits were derived from this "willingness to pay" criterion. Estimated hospital inpatient costs represented 16%, 5% and 3% of the cost of helmets needed to satisfy the law for cyclists aged 5-12, 13-18 and over 18 respectively.
A criticism of the willingness to pay approach is that there is likely to be substantial individual variation in willingness to pay. Moreover, forcing cyclists to wear helmets which they may find hot, uncomfortable or inconvenient also has its costs. Perhaps they should have been estimated by asking cyclists: if a magic helmet could be invented that satisfied the requirements of the law, was as effective as other helmets, but didn't feel hot, heavy or uncomfortable on your head, didn't look dorky, didn't muss your hair and didn't have to be carried around after parking the bike, how much would you be prepared to pay for it?
Because of the considerable variation in how much cyclists are inconvenienced by helmets, variation in how much they would be willing to pay to avoid an injury, and indeed risk of being head injured, it might be argued that this choice is best left to the individual. The willingness to pay is an estimate of the personal loss to an individual, which must be balanced against the personal loss from the inconvenience or discomfort of wearing a helmet. Decisions about compulsory wearing should therefore be based on costs borne by others in the community, such as healthcare costs. In this regard, the economic analysis of Taylor and Scuffham, 2002 is clear. Excluding costs to the individual making the decision about helmet wearing, the remaining costs borne by society as a whole are only a tiny fraction of the cost of helmets purchased because of the law.
Thus, when costs borne by the individual making the decision about helmet wearing are excluded, the New Zealand helmet law was not cost effective. Results for deaths and serious injuries to cyclists in Victoria (Figs 4 and 5) tell a similar story, in that there were no obvious benefits of helmets. Gradual changes were apparent in %DSHI in the years following the helmet law, but these could not be related to changes in helmet wearing. Helmets certainly prevent wounds to the head, the data from Victoria do not provide any strong evidence of a reduce incidence of serious head injuries. Based on this finding and the cost-benefit analyses for New Zealand (Taylor and Scuffham, 2002) and Western Australia (Hendrie, Legge, Rosman and Kirov, 1999), it seems very likely the costs of the helmet law in Victoria were far greater than the benefits. This suggests that helmet laws do more harm than good.
Definition of head injury and acknowledgement of data source
Thanks are due to the Victorian Transport Accident Commission (TAC) for kindly providing information on numbers of cyclists and pedestrians with fatal or serious injuries. TAC's definition of serious head injury comprised: skull fractures – ICD9 codes 800, 801, 803, 804 plus other brain injuries 851-854). Other serious injuries were those with ICD9 codes 806, 860-69, 901, 902, 599.7, 871, 878, 885-887, 895-897, 900, 940-957, 765.1, 870.3, 870.4, 994.1, 994.7, 810-817, 820-826, 831-834, 836-839, 802, 805, 807-809, 818, 819, 827-830, 835.
References
Bryan-Brown and Taylor, 1997
Bryan-Brown K, Taylor S, 1997. Cycle helmet wearing in 1996. Transport Research Laboratory Report 286.
Cameron, Vulcan, Finch and Newstead, 1994
Cameron MH, Vulcan AP, Finch CF, Newstead SV, 1994. Mandatory bicycle helmet use following a decade of helmet promotion in Victoria, Australia - an evaluation. Accident Analysis & Prevention 1994;26(3):325-337.
Carr, Dyte and Cameron, 1995
Carr D, Dyte D, Cameron MH, 1995. Evaluation of the bicycle helmet wearing law in Victoria during its first four years. Monash University Accident Research Centre Report 76.
Curnow, 2003
Curnow WJ, 2003. The efficacy of bicycle helmets against brain injury. Accident Analysis and Prevention 2003,35:287-292.
Ekman, Schelp, Welander and Svanstrom, 1997
Ekman R, Schelp L, Welander G, Svanstrom L, 1997. Can a combination of local, regional and national information substantially increase bicycle-helmet wearing and reduce injuries? Experiences from Sweden. Accident Analysis & Prevention 1997 May;29(3):321-8.
Elliot and Shanahan, 1986
Elliot, Shanahan, 1986. An exploratory study of high school students' reactions to bicycle helmets. Road Traffic Authority of Victoria .
Finch, Heiman and Neiger, 1993
Finch C, Heiman L, Neiger D, 1993. Bicycle Use and Helmet Wearing Rates in Melbourne, 1987 to 1992: the influence of the helmet wearing law. Monash University Accident Research Centre Report 45.
Hendrie, Legge, Rosman and Kirov, 1999
Hendrie D, Legge M, Rosman D, Kirov C, 1999. An Economic Evaluation of the Mandatory Bicycle Helmet Legislation in Western Australia. Road Accident Prevention Research Unit .
Hillman, 1993
Hillman M, 1993. Cycle helmets: the case for and against. Policy Studies Institute ISBN 0-85374-602-8.
Lee and Smyth 1996
Lee A, Smyth J, 1996. A bicycle helmet promotion campaign for the under 16 year olds in West Berkshire, England 1992-1995. Proc Velo Australis International Bicycle Conference, Freemantle .
Lee, Mann and Takriti, 2000
Lee AJ, Mann NP, Takriti R, 2000. A hospital led promotion campaign aimed to increase bicycle helmet wearing among children aged 11-15 living in West Berkshire 1992-98. Injury Prevention 2000;6:151-153. 
Maimaris, Summers, Browning and Palmer, 1994
Maimaris C, Summers CL, Browning C, Palmer CR, 1994. Injury patterns in cyclists attending an accident and emergency department: a comparison of helmet wearers and non-wearers. BMJ 1994 Jun 11;308(6943):1537-40.
Marshall and White, 1994
Marshall J, White M, 1994. Evaluation of the compulsory helmet wearing legislation for bicyclists in South Australia. South Australia Dept of Transport Report 8/94.
McDermott, Lane, Brazenore and Debney, 1993
McDermott FT, Lane JC, Brazenore GA, Debney EA, 1993. The effectiveness of bicycle helmets: a study of 1710 casualties. Journal of Trauma 1993; 34(6):834-845.
McGuire and Smith 2000
McGuire L, Smith N, 2000. Cycling safety: injury prevention in Oxford cyclists. Injury Prevention 2000;6:285-287.
Mock et al, 1995
Mock C, Maier R, Boyle E, Pilcher S, Rivara FP, 1995. Injury prevention strategies to promote helmet use to decrease severe head injuries at a Level 1 trauma centre. J Trauma 1995;39:29-33.
Powles and Gifford, 1993
Powles JW, Gifford S, 1993. Health of nations: lessons from Victoria, Australia. BMJ 1993 Jan 9;306(6870):125-7.
Robinson, 1996
Robinson DL, 1996. Head injuries and bicycle helmet laws. Accident Analysis & Prevention 1996 Jul;28(4):463-75.
Scuffham, Alsop, Cryer and Langley, 2000
Scuffham P, Alsop J, Cryer C, Langley JD, 2000. Head injuries to bicyclists and the New Zealand bicycle helmet law. Accident Analysis and Prevention 2000 Jul;32(4):565-73.
Sullivan 1990
Sullivan G, 1990. Initial effects of mandatory bicycle helmet wearing legislation. VicRoads Report IR90-15 1990.
Taylor and Scuffham, 2002
Taylor M, Scuffham P, 2002. New Zealand bicycle helmet law - do the costs outweigh the benefits?. Injury Prevention 2002;8:317-320.
Unwin 1996
Unwin NC, 1996. Cycle helmets – when is legislation justified?. J Med Ethics 1996 Feb;22(1):41-5.
Wasserman et al, 1988
Wasserman RC, Waller JA, Monty MJ, Emery AB, Robinson DR, 1988. Bicyclists, helmets and head injuries: a rider-based study of helmet use and effectiveness. American Journal of Public Health 1988 Sep;78(9):1220-1.