Head Injuries and Helmet Laws in Australia and New Zealand
Robinson DL
Last revised April 2012
Victoria was the first Australian State to introduce bicycle helmet laws, on 1 July 1990. Over the next few years, all other States passed similar legislation, because of threats by the Federal Government to reduce road funding if States failed to comply with a 10-point road safety program including bicycle helmet laws. New Zealand (NZ) also introduced a bicycle helmet law in January 1994. (Carr, Dyte and Cameron, 1995, Robinson, 2001, Hendrie, Legge, Rosman and Kirov, 1999, Marshall and White, 1994, Robinson, 1996)
Did the laws work?
The effect of the laws can be determined by comparing injury rates before and after the laws were introduced.
Victoria
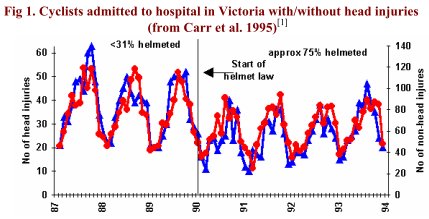
Fig1 shows numbers of cyclists admitted to hospital with and without head injuries before and after the helmet law. Both head and non-head injuries fell substantially. As shown later (section 3), surveys revealed lots of people were put off cycling. Fewer cyclists should mean fewer injuries. But if helmets were effective, head injuries should have fallen by more than non-head injuries. Did they? Which line represents head injuries and which non-head injuries?
|
 |
 |
New Zealand
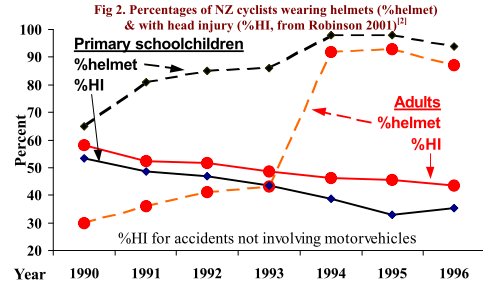
Fig 2 compares head injury (%HI) rates of primary school children and adults admitted to hospital. Most primary school children were already wearing helmets, so the law should have had little effect on their %HI. However, adult helmet wearing (%HW) increased from 43% to 92%. If compulsory wearing is beneficial, there should have been a large reduction in %HI of adults compared to primary school children. Fig 2 shows there wasn't; both followed similar declining trends. What other explanation is there, except that helmets are less effective at preventing head injury than most people think?
|
Western Australia
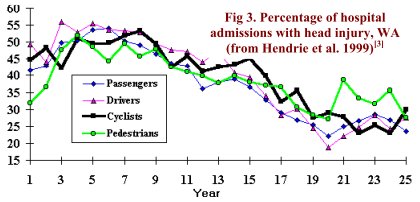
Fig 3 shows percentages of hospital admissions involving head injury for all road users. Helmet wearing at the start of the data series was virtually nil, increasing to about 39% of cyclists just before the law was enacted on 1 Jan 1992, when helmet wearing increased to over 80%. The most dominant feature in Fig 3 is the declining trend in %HI common to all road users. Researchers in Victoria found a similar trend, but mistakenly concluded helmets were remarkably effective. They didn’t bother to check that the same trend was evident for pedestrians, so had nothing to do with helmets! If helmet laws are effective, it should be obvious from the WA data when %HW increased from 39% to more than 80%. Can you tell which year it was? (a later section has more details.)
|
 |
 |
South Australia
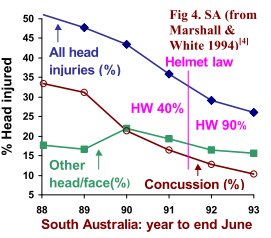
(SA, Fig 4) shows declining trends in hospital admissions for concussion, but not other head/face injuries, and again no obvious effect of a law that increased helmet wearing from 40-90%. The decrease in concussions was noted and explained:
"it is understood that, since helmet wearing became compulsory, the procedure for patients with a short episode of concussion has changed in that such patients are not now admitted routinely." (Marshall and White, 1994)
|
New South Wales
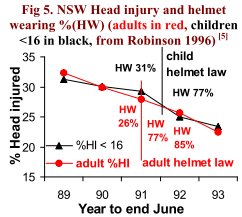
(NSW, Fig 5) introduced a helmet law for children 6 months after the law for adults. Numbers of cyclists admitted to hospital for head and other injuries were provided by NSW Health (Robinson, 1996). As in other states, the dominant feature is a declining trend in %HI for both adults and children, with very little additional effect from the substantial increases in helmet wearing due to the law.
|
 |
Summary of head injury data
The data in Figs 1-5 show large increases in helmet wearing, but no major change in %HI, over and above the general trends. These trends may relate to new diagnostic techniques (e.g. CAT scans), changes in admission policies (as in SA), and safer roads (leading to lower impact speeds in collisions, reducing the risk of head injury - Janssen and Wismans, 1985). Thus it seems impossible to conclude from %HI data that helmet laws have any large or significant benefit.
Successful road safety measures
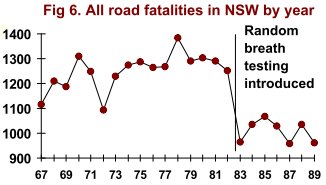 |
Not all road safety measures show almost undetectable responses. Road fatalities fell immediately, and remained at a lower level, when random breath testing was introduced in NSW (Fig 6). Some measures – e.g. those encouraging responsible driving – seem remarkably effective.
|
|
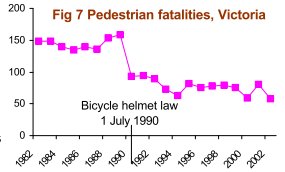
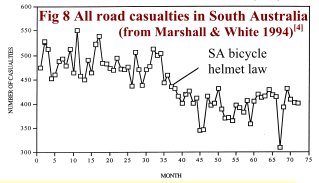
In Victoria, campaigns against speeding and drink-driving were introduced about the same time as the bicycle helmet law. A medical journal reported that accident costs were reduced by an estimated GBP 100M for an outlay of GBP 2.5M (Powles and Gifford, 1993). Fig 7 shows the fall in pedestrian fatalities. Other states also introduced road safety campaigns about the same time as their helmet laws. Fig 8 shows all road casualties in SA in relation to the timing of the helmet law.
Figs 7 and 8 demonstrate why we must take care when claiming benefits of helmet laws. Cyclists are likely to benefit just as much as pedestrians from campaigns to reduce speeding and drink-driving. Some proponents of helmet laws have shown the equivalent of Fig 7 and 8 for cyclists, without explaining that similar benefits were enjoyed by other road users. The Cochrane Review of Thompson et al. fails to mention the fall in non-head injuries in Victoria (Fig 1), and dismisses the much safer road conditions (Fig 7), leading to the impression that the entire 40% fall in head cyclists’ head injuries was due to increased helmet wearing (Thompson, Rivara and Thompson, 2002-9).
|
|
Summary of injury data
Despite the lack of obvious change in %HI in response to increased helmet wearing from legislation (Figs 1-5), proponents of helmet laws have claimed the laws were effective. They usually fail to mention important aspects of the data, such as the similar trends in %HI for all road users (Fig 3), that non-head injuries fell by almost as much as head injuries (Fig 1), or the large reductions in the amount of cycling (see next section).
Effect on cyclists, health and the environment
Australian and NZ helmet laws are enforced. In Victoria, about 20,000 cyclists are fined every year for not wearing a helmet. Some cyclists have even gone to jail for non-payment of helmet-law fines. Does the threat of a fine encourage cyclists to wear helmets, or just discourage cyclists who don’t like helmets from riding?
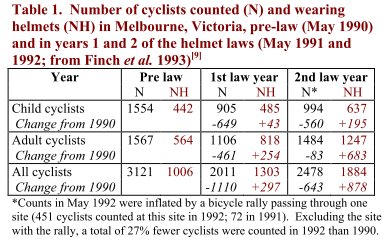 |
Table 1 shows the results of a large, comprehensive survey in Melbourne, using the same observation periods at 64 sites, in similar weather and the same time of year (May). Before the law, 442 children wore helmets voluntarily. A year later, 43 more wore helmets. The big change was that 649 fewer children were counted. This strongly suggests that the main effect of the law, was to discourage cycling rather than encourage helmet wearing. Compared with before the law, 42% few child and 29% fewer adult cyclists were counted.
|
|
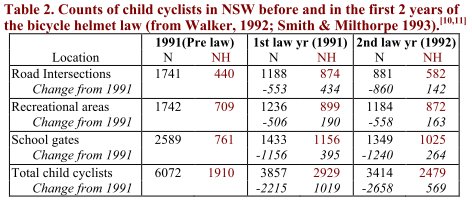
Large declines were also noted in a comprehensive survey of child cyclists at 122 sites covering Sydney, regional and rural areas of NSW. Before the law, 1910 children were observed wearing helmets. In the first and second years of the law 1019 and 569 more children were observed wearing helmets, but 2215 (36%) and 2658 (44%) fewer child cyclists were counted (Table 2).
|
 |
|
Proponents of helmet laws have argued that the above data are outdated and distorted by a reduction in the legal driving age. This is untrue. In Victoria, teenagers who pass the driving test may drive unsupervised from age 18. This has not changed, though the minimum age for a learner permit was lowered from 17 to 16 in Victoria. Learners must be supervised at all times by a licensed driver, so it seems unlikely this caused any significant part of the 42% fall in children’s cycling, or the 29% fall in adult cycling in Melbourne. Moreover, there was no change in NSW, yet, by the 2nd year of the helmet law, child cycle use had fallen by 44%.
|
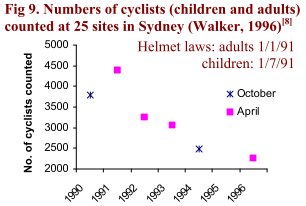 |
There is no evidence that the decline in cycling was transient or that cycling “recovered”. Fig 9 shows a series of counts over 6 years at 25 sites in Sydney. Both adult and child cyclists were counted (Walker, 1996). There were four surveys in April and two in October. More cyclists were observed in April than October, perhaps because autumn weather may be more conducive to cycling. However, by 1996, there were 48% fewer cyclists than 1991. This is in complete contrast to the situation before the law, when, in the Sydney metropolitan area "cycling increased significantly (+250%) in the 1980s" (Webber, 1992).
|
People often cite helmet laws as a reason for not cycling. The equivalent of 64% of adult cyclists in Western Australia said they'd ride more except for the helmet law (Heathcote and Maisey, 1994) In New South Wales, 51% of schoolchildren owning bikes, who hadn't cycled in the past week, cited helmet restrictions, substantially more than other reasons, including safety (18%) and parents (20%) (Blacktown).
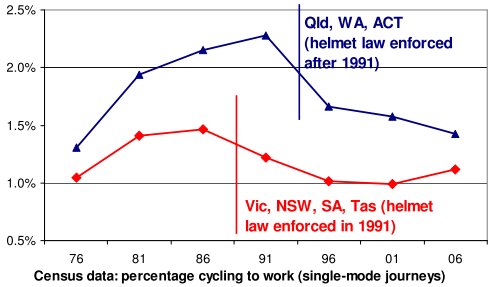
Long-term trends are also evident in census data on cycling to work. A comparison of states without enforced helmet laws in 1991 (Qld, WA, ACT), and states with enforced helmet laws, suggests that the trend of increasing cycling to work reversed when helmet laws were enforced.
|
Census data for a small area can be affected by the weather on census day. In Melbourne, for example, the last census before the helmet law (30 June 2006) had unusually cold weather (minimum 0.8 C). Subsequent censuses took place in August, with census day in 2006 enjoying milder weather (minimum 5.3 C). To average out any local weather effects, the graph covers the widest possible area, expressing the total number of people who cycled to work in each group of states as a percentage of the total number who travelled to work by one mode in those states.
|
 |
In the mid to late 1980s, cycling was undergoing a surge in popularity. In Western Australia (WA), numbers cycling more than once a week increased from 300,000 in 1986 to 400,000 (27% of population) in1989. More cycling led to safer cycling – deaths and serious injuries per regular cyclist in WA fell from 5.7 in 1986 to 3.8 in 1989 (Robinson, 1996). Cycling increased significantly (+250%) in the Sydney metropolitan area (Robinson, 1996). Long-term comparisons show substantial declines in cycling compared even to pre-law levels before or during the early part of the boom. Surveys in Western Australia showed a 33% decline in cycling to work from 1986 to 2006 (from about 1.5 to 1.0 trips per weekday per 100 people), consistent with the census data. Shopping trips fell by 55%, from about 5.2 to 2.3 per weekday per 100 people; trips for education by 79%, from about 8.2 to 1.7 per weekday per 100 people (Ker, 2011).
The Cycling Promotion fund conducted a random survey of 1000 Australians in 2011. Of 515 respondents who were not interested in cycling for transport, 81 cited as a reason that they didn’t like wearing helmets. Only 158 cyclists cycled for transport in the past month - 81 more transport cyclists would represent a 51% increase, on top of the 16% of current transport cyclists who said that they would cycle more if not required to wear a helmet (CPF, 2011). A cross-sectional survey in Sydney in 2010 asked is people would cycle more if they did not have to wear a helmet. The researchers concluded:
“While a hypothetical situation, if only half of the 22.6% of respondents who said they would cycle more if they did not have to wear a helmet did ride more, Sydney targets for increasing cycling would be achieved by repealing mandatory bicycle helmet legislation”. (Rissel and Wen, 2011)
Lack of exercise is a major health problem in most western societies. The New Scientist has reported that poor diet and physical inactivity may soon overtake tobacco as the leading cause of death.
Other studies show the health benefits of cycling greatly exceed losses from accidents. UK researcher Mayer Hillman estimated that 20 life years were gained from the health benefits of cycling (even without a helmet), for every year lost through accidents (Hillman, 1993). If bicycle helmet laws discourage cycling, as in Australia, our health will be worse, not better. If cycling for transport is discouraged, cars may be used instead, increasing vehicle pollution and greenhouse gas emissions.
Safety in numbers
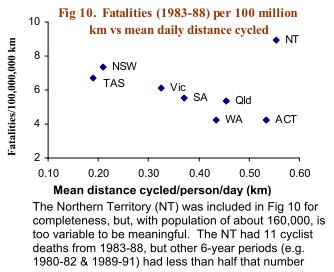
An interesting paradox is that countries with helmet laws (and therefore high helmet wearing rates) tend to have higher injury rates per kilometre cycled than countries with low helmet-wearing rates. This again suggests that helmet laws are counter-productive. Helmet law promoters often try to dismiss these facts, but it is better to examine and understand the evidence, than ignore it.
A really important paper, published in the prestigious international journal, Injury Prevention, has a very plausible explanation (Jacobsen, 2003). It reported that the risk per cyclist (and pedestrian) is lower when there are more cyclists (pedestrians). For 6 different datasets, a consistent relationship was found, comparing a) data from different countries, b) different cities and towns in the same country, and c) comparing injury rates and amounts of cycling in the same country over time (Jacobsen, 2003). This relationship, called the Growth Rule, shows that when cycling doubles, injury rates per cyclist falls by an average of 34%. Conversely, according to the Growth Rule, if cycling halves the risk per cyclist will increase by 52% (Jacobsen, 2003).
|
‘Safety in Numbers’ is also true for Australia. The last comprehensive dataset on cycle use was for 1985, but it shows a very strong relationship between distance cycled in different Australian states and fatality rates per km cycled (Fig 10). States with the most cycling (Australian Capital Territory, Queensland and Western Australia) had the lowest fatality rate per km cycled; those with the least cycling the highest fatality rate per km.(Robinson, 2005b)
|
 |
So what happened with the helmet laws? Did cyclists have higher injury rates, due to the fall in cycling with the law? As noted earlier, we must allow for the fact that helmet laws were introduced at the same time as road safety campaigns that reduced deaths and serious injuries to other road users (Figs 7 and 8). Safer roads should lead to fewer collisions with motor vehicles. Moreover, when collisions occur, impact speeds should be lower, reducing the risk of both death and serious head injury. In experiments designed to mimic pedestrians and cyclists hit by vehicles, lowering impact speed from 40 to 30 km/hr reduced maximum head acceleration by 39% (and head injury criterion by 66%), compared to 20-25% reductions in maximum acceleration of chest, pelvis and feet (Janssen and Wismans, 1985).
We can allow for the safer roads by noting that pedestrian and cyclist injuries follow very similar trends (Robinson, 1996). So, by comparing pedestrian and cyclist safety before and after the law, we can evaluate whether cyclist head injuries declined (compared to pedestrians) with increased helmet wearing, or whether the fall in cycling increased injury rates, because of reduced ‘Safety in Numbers’.
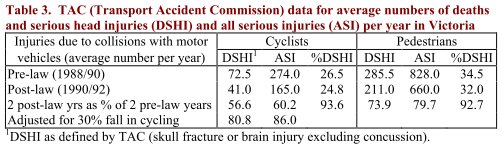 |
Table 3 shows that, in the two years before the law, deaths and serious head injuries (DSHI) represented 26.5% of all serious injuries (ASI) to cyclists in bike/motor vehicle collisions in Victoria. This fell by 1.7 per- centage points to 24.8% in the 2 years after the law. For pedestrians, the fall over the same period was actu- ally greater – 2.5 percentage points. Helmets are popularly believed to prevent death and serious head injury, yet the fall in %DSHI for pedestrians was actually greater than that achieved for cyclists with the law.
|
Estimated injury rates per cyclist also suggest that ‘Safety in Numbers’ operated in reverse. Pedestrian DSHI fell to 74% of pre-law numbers (Table 3), thanks to the road safety campaign already mentioned. Cyclist DSHI fell to 57% of pre-law numbers, but there were fewer cyclists – only 69% as many as before the law (Table 1). DSHI should therefore have fallen to (69% x 74%) = 52% of pre-law numbers for cyclists to enjoy the same injury reductions as pedestrians. The actual fall suggests that cyclists did not fare as well with the helmet law as they ought to have done without it. Increased injury rates following helmet laws was also noted for child cyclists in NSW (Robinson, 1996). This strongly suggests that helmet laws are counter-productive and may increase the risk of death and serious injury. As well as reduced ‘Safety in Numbers’, another possible factor is risk compensation; cyclists may take more risks, or motorists take less care when they encounter cyclists, because of the apparent protection of helmets.
Risk compensation
Although helmets may provide some protection when accidents occur, they may also increase the risk of accidents because of risk compensation. Pioneering research in the UK showed that drivers leave less room when overtaking helmeted cyclists. The risk of particularly tight passing events doubled when a helmet was worn. The researcher, Dr Ian Walker, was hit twice - by bus and a truck in the course of the experiment, both times when wearing a helmet. (Walker, 2007; McLaughlin, 2006)
Other research found that cyclists accustomed to wear helmets ride faster when wearing them, again suggesting that the act of wearing a helmet makes people feel safer and encourages them to take more risks, potentially increasing the accident rate. (Phillips, Fyhri and Sagberg, 2011)
Cost-benefit analyses
Any realistic estimate of the cost of helmet laws should include health and environmental costs of reduced cycling, as well as any increases in injury rates from risk compensation or reduced ‘Safety in Numbers’. This has never been done; research into helmet laws has generally been funded by government agencies.
Nonetheless, the published cost-benefit analyses provide some very interesting information – that the risk of head injury per cyclist is relatively small. For this reason alone, helmet laws cost the community money. For example, in New Zealand, adult cyclists spent NZ$5.9 million on helmets, but the most optimistic estimate was that the law saved NZD 0.17 million in treating head injuries (See Table 1 of Taylor and Scuffham, 2002) Even this is debatable. Head injury data for NZ are shown in Fig 2. Helmet wearing of adults rose dramatically with the law, but there was little change for primary schoolchildren. Yet percent head injury (%HI) of both groups follow similar trends. In fact, %HI for primary schoolchildren actually declined slightly more than adults. Thus, despite its $5.9 million price tag, the helmet law for adults may not have prevented any head injuries whatsoever. The most optimistic estimate of the savings in head injury treatment costs (Table 4) is NZD 0.13 per helmet per year.
Table 4. NZ helmet law - most optimistic (MO) estimates of the savings in healthcare costs (from Taylor and Scuffham, 2002)
| Age group |
5-12 |
13-18 |
Adult |
All |
| Number of helmets required |
10,195 |
84,999 |
328,162 |
423,356 |
| Helmet cost (NZD million, per 5 years) |
0.47 |
1.28 |
4.29 |
6.04 |
| MO estimates - head injury treatment saving (NZD million, per 5 years) |
0.03 |
0.08 |
0.17 |
0.28 |
| MO estimates - head injury treatment saving per helmet per year (NZD) |
0.56 |
0.18 |
0.11 |
0.13 |
Another cost-benefit analysis was carried out for Western Australia (WA) by Delia Hendrie, University of WA. She estimated that the WA helmet law cost $21.6 million, including $20.2 million to purchase helmets (Hendrie, Legge, Rosman and Kirov, 1999).As discussed earlier, %HI of cyclists followed similar trends to that of other road users (Fig 3). However, the graph has a very curious feature – a large increase in %HI of pedestrians (but not other road users) in year 21, a year before the helmet law. This seems to have been transient. By year 25, pedestrian %HI had fallen below that of cyclists. However, if, without the law, cyclists %HI were presumed to follow exactly the same trend as pedestrians (a highly contentious assumption!) the average difference over this period, about 20 to 44 head injuries per year, mostly of moderate severity, might (albeit unrealistically) be deemed an effect of the law. Depending on the model fitted and how costs of head injuries are calculated, net benefits, estimated in this unrealistic way, range from AUD -15.1 million (i.e. the law still cost AUD 15.1 million more than an unrealistically optimistic estimate of what it saved) to AUD 2 million.
Recent attention has focused on the health benefits of cycling. A Danish study reported that, after adjustment for age, sex, and educational level, people who did not cycle to work had about 40% higher mortality than those who did. Adjusting for leisure time physical activity, body mass index, blood lipid levels, smoking, and blood pressure made very little difference – not cycling to work increased mortality rates by 39%. (Andersen, Schnohr, Schroll and Hein, 2000)
An economic analysis by Price Waterhouse Coopers for the NSW RTA in 2009 concluded: “Using the most conservative assumptions in all cases, the estimated net benefits of cycling were found to be 48.22 cents per bicycle kilometer” (PWC, 2009). This again suggests that the benefits of cycling are much greater than the estimated maximum reduction in hospital costs (NZ data, 0 to 13 cents per year, Table 4 above.)
A Canadian researcher also explored the costs and benefits of bicycle helmet laws, concluding that if the helmet law reduces cycling by more than a quarter of one per cent, there will be a net loss, rather than a benefit. It was estimated that British Columbia’s helmet law has cost 500 lives since its introduction in 1996, compared to an estimated saving of 7 lives. (Johns, 2011)
Thus if estimates of lost benefits from reduced cycling are included in the costs, helmet laws cost far more than any realistic estimate of their benefits.
What causes brain injury?
Experimental evidence shows that brain damage is caused mainly by rotation. Rotational forces can shear the brain’s neuronal connections, a condition known as diffuse axonal injury (DAI). In one experiment 12 squirrel monkeys were subjected to linear accelerations with peak levels 665-1230 g, and 13 primarily to rotational accelerations in the range of 348 to 1025 g (Gennarelli, Thibault and Ommaya, 1972). Contact phenomena were minimised by the design of the apparatus. None of the monkeys receiving linear acceleration was concussed, but all 13 receiving rotational acceleration suffered concussion, and the group had a high incidence of brain injuries such as subdural haematoma, subarachnoid haemorrhage and intracerebral petechial haemorrhage.
There is little reliable evidence whether bicycle helmets reduce, or increase, the risk of rotational injury. No-shell helmets may stick on pavement and increase the risk of rotating the head. The Australian NHMRC (National Health and Medical Research Council) discussed football helmets (which may have some similarity with bike helmets), stating:
"The use of helmets increases the size and mass of the head. This may result in an increase in brain injury by a number of mechanisms. Blows that would have been glancing become more solid and thus transmit increased rotational force to the brain. These forces result in shearing stresses on neurones which may result in concussion and other forms of brain injury." (NHMRC, 1994)
Does this happen in real life? In a paper, "Cycling: your health, the public’s health and the planet’s health", Public Health Physician, Dr Ashley Bloomfield wrote:
"The earliest murmurings that I heard against helmets were from a neurosurgeon who I worked for in 1994. He claimed that cycle helmets were turning what would have been focal head injuries, perhaps with an associated skull fracture, into much more debilitating global head injuries. We had a couple of examples on the ward at the time, and it was a bit worrying. However, I wasn’t too convinced as I figured that the injuries that would previously have been focal head injuries may well have been resulting in death, so the neurosurgeon was never actually seeing them. Instead, they were making their way straight to the pathologist." (Bloomfield, 2000)
However, the comparison of pre- and post-helmet law statistics for pedestrians and cyclists in Victoria (Table 3), suggests that helmets prevent few, if any deaths or serious head injuries (DSHI). In fact, DSHI to cyclists, as a proportion of all serious or fatal injuries to cyclists (%DSHI), fell by (marginally) less than the same statistic for pedestrians. More importantly, the risk of death or serious head injury per cyclist actually increased compared to what would have been predicted without the law.
Thus, there is some worrying evidence that helmets might increase the risk of rotational injuries. This may explain the increase in DSHI, compared to what would have been expected without the law. Other factors such as risk compensation and reduced ‘Safety in Numbers’ may also be important. Available data are insufficient to draw any firm conclusions. One problem is that diffuse axonal injury (DAI) is very hard to see on CAT scans, so many cases may be missed.
In motorcyclists, the serious brain damage from rotational injuries (despite, presumably, wearing traditional helmets) was noted by physician Dr Ken Phillips. He was so concerned he decided to try and improve matters. Dr Phillips observed that the scalp provides the brain with protection against rotational forces because it is elastic, compressible and moves around the skull without friction. To mimic this process, the 'Phillips helmet' has an outer shell of polyethylene that moves independently of the inner cushion (Phillips helmets). Unfortunately, no helmet manufacturer was interested, so Dr Phillips started his own company to make and market them.
The final paradox
The evidence reported here indicates that helmet laws are not effective and may even increase the risk of injury per cyclist. The many reasons for this include: risk compensation, reduced safety in numbers, failure to wear helmets correctly and the fact that helmets probably offer little protection against the most debilitating type of brain injury – rotational injuries.
So why is so much effort expended promoting helmet laws? One source of confusion is that case-control studies comparing cyclists choosing to wear helmets with helmetless cyclists usually show that helmet wearers have a lower %HI. But why? Is this because helmets offer some benefit, or that cyclists choosing to wear helmets are more cautious, have different riding styles and get into less serious accidents? Studies show that cyclists who chose to wear helmets are more likely to obey traffic signs, wear high visibility clothing, have higher socioeconomic status, use lights at night, ride in parks, playgrounds, or on bicycle paths, rather than city streets, (in the US) be white rather than other races, and (for children) tend to ride with other children or adults, rather than alone (Robinson, 1996). One US study also found that helmet wearers had much less serious non-head injuries, as well as head injuries.
Although case-control studies try to control for these differences (known as confounding factors), it is virtually impossible to record and control for all differences between wearers and non-wearers. This problem was discussed in a series of papers in the International Journal of Epidemiology (IJE) in June 2004, after a similar paradox was noted for hormone replacement therapy (HRT). (Petitti, 2004)
In 1991, a review of the best quality observational studies concluded that HRT reduced the risk of coro- nary heart disease by 50%, and that ‘overall, the bulk of the evidence strongly supports a protective effect of estrogens that is unlikely to be explained by confounding factors’ (Lawlor, Smith and Ebrahim, 2004). Yet when randomized control trials were carried out, the exact opposite was found – that HRT increased the risk of coronary heart disease by 29%. Just as cyclists who choose to wear helmets tend to be more cautious and have higher socioeconomic status, women choosing HRT also tend to have higher socioeconomic status. Results from the observational studies had, in fact, suggested the possibility of bias from confounding; HRT was apparently equally protective against accidental and violent deaths as it was against cardiovascular disease deaths in one observational study. (Lawlor, Smith and Ebrahim, 2004)
Can similar checks for bias be applied to case-control studies of helmet efficacy? In the most widely citied study, most (86%) of the community controls were children under 15 (Thompson, Rivara and Thompson, 1989). 21.1% wore helmets when they fell of their bikes, compared to 5.9% of 202 children given emergency room treatment in Seattle for non-head injuries. The odds ratio for helmets preventing head injury (HI) was calculated by comparing the 143 HI children (‘cases’) with the community controls (Thompson, Rivara and Thompson, 1989). In exactly the same way, children treated for injuries to other parts of the body can be considered ‘cases’. This produces an odds ratio of 0.23, indicating that helmets prevent 77% of injuries to other parts of the body! This suggests, as was found for the HRT observational studies, that much of the estimated benefits could be artifacts of confounding.
Another indicator of potential confounding was that surveys at the same time as the widely-cited Seattle study found that 3.2% of 4501 child cyclists riding round Seattle wore helmets (DiGuiseppi, Rivara, Koepsell and Polissar, 1989). This is not significantly different from the 2.1% and 5.9% helmet wearing (%HW) of children with head and non-head injuries. However, all three are completely different from the 21.1% HW of the community controls (p < 0.001). We might therefore conclude that helmet wearers are nearly 7 times more likely to fall off their bikes than non- wearers, suggesting that risk compensation is far more important than any possible benefits of helmets. However, this may also be an artifact of confounding. Community controls were members of a Group Healthcare Cooperative that may have promoted helmet wearing to members. Children might also be persuaded to wear helmets when they are more likely to fall off their bikes, e.g. when learning to ride. Thus we may conclude it is very difficult to fully adjust for confounders in observational studies of helmet efficacy.
The best estimates of the benefits of helmets laws are those based on what actually happens when such laws are introduced. As shown in Figs 2-5, even though other road safety measures achieved large reductions in injury rates (Figs 6-8), there were no major changes in cyclists %HI when helmet laws were introduced. In contrast, the large fall in non-head injuries (Fig 1) suggests the laws discouraged cycling.
Conclusions
Comparisons of pre- and post-law injury data (Figs 1-5) show that there is little benefit to either cyclists or the community from passing laws forcing cyclists to wear helmets. Rather than encouraging cyclists to wear helmets, the laws appear to have discouraged cycling, resulting in reduced health and fitness, but very little change in %HI. If the money spent on helmets had been used for other measures e.g. improving accident blackspots for cyclists, the benefits would have much been greater.
More importantly, risks per cyclist seem to have increased, compared to what would have been expected without the law, implying that helmet laws are counter-productive. Possible explanations include risk compensation, reduced ‘Safety in Numbers’ and that brain damage is predominantly due to rotational injury.
Helmets undoubtedly help prevent minor wounds to the head, but are not designed to cope with the forces that may occur in bike/motor vehicle collisions. There is little reliable experimental evidence whether bicycle helmets reduce, or increase, the risk of rotational brain injury. However, as a precaution, cyclists choosing to wear helmets may wish to consider new designs such as the ‘Phillips’ helmet.
In contrast to the little or no obvious change in %HI with bicycle helmet laws, injury statistics following measures to reduce speeding and drink driving (Figs 6-8) show considerable benefit. The vast majority of fatal and very serious head injuries to cyclists result from bike/motor vehicle collisions. The most effective way to reduce injuries to cyclists and all other road users is therefore to reduce the risk of bike/motor vehicle collisions.
As well as enforcing appropriate speed limits, controlling drink-driving and encouraging cyclists to use lights at night and ride on the correct side of the road, cycling becomes safer when more people cycle. The best option to improve overall safety, improve our health and fitness and benefit the environment is therefore a package of measures to encourage cycling and make the roads safer, while allowing cyclists to chose whether of not they wish to wear helmets.
Sources of data
The data shown have been compiled over many years from many sources. Data on injuries to cyclists and pedestrians in Victoria (Table 3) were kindly provided by the Victorian Transport Accident Commission. The appendix provides more details on how head injuries are classified. Fatality data (Figs 6 and 7) were obtained from the ATSB website (www.atsb.gov.au). Other data were obtained from the referenced papers and reports.
Appendix: Other published analyses and description of head injuries
Other published analyses of head injury data
The data in Figs 1-5 show that, in contrast to the large benefits from campaigns against speeding and drink-driving (Fig 6-8), there was no obvious change in %HI from bicycle helmet laws. Indeed, the large reduction in non-head injuries (Fig 1) suggests the main effect of the laws was to discourage cycling, rather than protect against head injury. Despite this, proponents of helmet laws claim they are effective; they advise cyclists that wearing a helmet may save their lives. This divergence of opinion is discussed by reviewing research frequently cited by advocates of such laws.
One widely-cited report is: Carr et al. (Monash Univ Accident Research Centre (MUARC), 1995) (Carr, Dyte and Cameron, 1995). It notes (as is obvious in Fig 1) that numbers of head injuries fell by 40% after the helmet law in Victoria. The authors explained they could not tell from their analysis whether this was because fewer people cycled after the law, or because helmet wearing increased. So why analyze numbers of head injuries? MUARC’s analysis of the first 3 years of helmet law data found that %HI was no different to that predicted from pre-law trends (Cameron, Newstead, Vulcan and Finch, 1994). Might we speculate the main reason for focussing on numbers (rather than percentages) of head injuries was a desire to justify the helmet law?
Another widely-cited publication was MUARC’s analysis of the first 2 years of helmet-law data:
"(TAC) insurance claims from bicyclists killed or admitted to hospital after sustaining a head injury decreased by 48% and 70% in the first and second years after the law, respectively. Analysis of the injury data also showed a 23% and 28% reduction in the number of bicyclists killed or admitted to hospital who did not sustain head injuries in the first and second post-law years, respectively." (Cameron, Vulcan, Finch and Newstead, 1994)
Fig 1 shows all cyclist hospital admissions, irrespective of whether the cyclist fell off the bike, or was hit by a fast moving motor vehicle. Although risk compensation might also be important, we may hypothesize that the dominant influence on numbers of non-motor-vehicle injuries is the amount of cycling. The observational surveys (Table 1), and the fall in numbers of non-head injuries (Fig 1), strongly suggest the main effect of the law was to discourage cycling. Thus the most likely cause of the 40% reduction in head injuries was that the law discouraged cycling.
In contrast, insurance claims for injuries in motor vehicle accidents also depend on other factors, including driver behaviour and vehicle travelling speeds. This was demonstrated by the 42% in pedestrian deaths from1989 to 1990 (Fig 7). Table 3 compares deaths and serious head injuries (as a percentage of all serious injuries, %DSHI) of pedestrians and cyclists in motor-vehicle accidents. The fall %DSHI of pedestrians was actually greater than for cyclists. Indeed, the risk of DSHI per cyclist appears to have increased relative to that for pedestrians.
MUARC didn’t use pedestrians as a control and didn’t explain that numbers of pedestrians with concussion fell by 29% and 75% in the first and second years of the helmet law. This reduction for pedestrians is almost as impressive as the 48% and 70% falls in head injuries of cyclists over the same period, compared to 23% and 28% falls in other injuries. It implies that helmets were not the main cause. One refereed paper set the record straight by comparing all head injuries, including concussion, of pedestrians and cyclists, showing both followed almost identical trends. (Robinson, 1996)
Section 3 uses the alternative approach of considering only deaths and injuries serious enough to warrant admission to hospital. Table 3 was based on TAC’s classification of serious head injury, i.e. skull fracture (ICD-9 codes 800, 801, 803, 804) and brain injuries (codes 851-854), but not or wounds to the head or concussion with no other sign of brain injury. This contrasts with MUARC’s definition of "bicyclists killed or admitted to hospital after sustaining a head injury", which included concussion and wounds to the head or ears, even if the main reason for admission was a serious injury to another part of the body. (Cameron, Vulcan, Finch and Newstead, 1994)
Table 3 shows the risk of death and serious head injury (as defined by TAC) increased relative to that for pedestrians. We may therefore conclude that the widely-quoted claims of 48% and 70% reduction in cyclist head injuries were mainly due either to changes in admission procedures and improved road safety conditions (resulting in 29% and 75% reductions in numbers of concussions to pedestrians). Cyclists admitted to hospital for treatment of serious injuries to other parts of the body may also have had fewer head wounds. Most people wear helmets because they hope to be protected against death and serious head injury. Despite the claims of helmet law proponents, TAC data suggest that the helmet laws in Victoria actually increased the risk of DSHI relative to the amount of cycling.
Other published analyses of the amount of cycling
The abstract of MUARC publication claiming 48% and 70% reductions in head injuries also stated:
“Surveys in Melbourne also indicated a 36% reduction in bicycle use by children during the first year of the law and an estimated increase in adult use of 44%”
Yet the survey data (Table 1) show 29% fewer adults were counted in May 1991 than May 1990. So why did MUARC claim that adult cycling increased by an estimated 44%? MUARC estimated cycle use from the time cyclists took to ride through marked areas. However, in 1990, adult cyclists were counted, but not timed. This should not preclude adult cycle use from being estimated, because numbers counted and estimates of cycle use are strongly correlated. For example, the first post-law survey found a decline in cycle use by teenagers of 44%, little different from the 48% drop in numbers counted. This implies that the 29% decline in number of adults counted is a valid and reasonable estimate of the change in adult cycle use.
But instead of reporting this direct estimate, MUARC ignored the number of adults counted in 1990, and estimated the effect of the law by comparing adult cycle use in 1991 with a much earlier survey (1987/88) at a different time of year. This is a totally invalid because (as can be seen in Figure 1) cycle use has a marked seasonal variation. If the same “trick” of ignoring data from1990 had been carried out for teenagers, MUARC could have claimed the law reduced teenage cycle use by a mere 8%, instead of the 44% actually observed!
The decisions taken by MUARC to base their final analysis on numbers of head injuries, rather than percentages, and ignore numbers of adult cyclists counted in 1990, created considerable confusion about the effects of helmet laws. Governments may have wished the laws to be considered successful. However, readers of the original reports would understand the data were open to other interpretations. Unfortunately, summary reports by proponents of helmet laws in other countries often omitted all-important details, leading to the false impression that the laws were remarkably successful. Figs 1-5, showing the original data, demonstrate that this was not the case. Readers should inspect the graphs, in conjunction with details about how the data were compiled (below), and make up their own minds.
Mistakes in relation to HRT were discussed in the International Journal of Epidemiology. Four important lessons had to be learned: 1) do not turn a blind eye to contradiction, 2) do not be seduced by mechanism, 3) suspend belief and 4) maintain skepticism (Petitti, 2004). Bicycle helmet researchers, who use same methods, need to learn the same lessons. Helmet law promoters believe helmets work; the mechanism (they absorb energy) is seductive. Cyclists who doubt the benefits may be less likely to wear helmets. So promoters ignore contradictory evidence about risk compensation, causes of brain injury and that increased wearing from 30-40% to 75-90% following helmet laws produced no large or obvious response in %HI.
Helmet laws promoters also cite data showing generally declining trends in %HI coinciding with increasing trends in helmet wearing. But Fig 3 shows declining trends commonly affect all road users. It is therefore impossible to separate effects of long-term trends from gradual changes in helmet wearing as a result of education, or non-enforced laws.
The Australian and New Zealand data are unique in that they produced very large, rapid, increases in helmet wearing – 40 or 50 percentage points. Yet there was no obvious response in %HI, but large reductions in the amount of cycling, (Figs 1-5, Tables 1-3). This provides strong, compelling evidence that helmet laws do not work, refuting the claims of those who wish to compel all cyclists to wear helmets.
Classification of head injury data (Figs 1 - 5, Table 3)
As shown in the acknowledgments, Figs 1-5 were complied from other publications, using other people’s classification of head injury. The example for Victoria (Appendix A1) showed that different classifications may reveal different effects. No effect of the helmet law was detectable in comparison with pedestrians, but larger trends in %HI were evident when concussion (with no other sign of brain injury) was included. The definitions of head injury for Figs 1- 5 and Table 3 are therefore listed below to enhance understanding of the data.
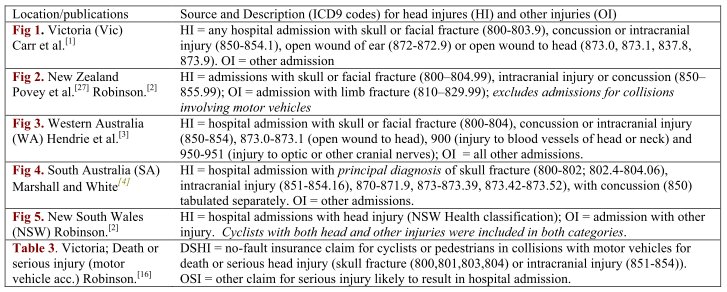
Most classifications included all head injuries: skull and facial fractures, intracranial injuries, concussion and wounds to the head. As discussed in Section 5, the most debilitating brain injuries may be caused by rotations, for which helmets might not offer any protection. However, helmets undoubtedly prevent wounds to the head, so some effect of increased helmet wearing could be expected when head wounds are included – Figs 1 (Vic), 3 (WA) and presumably 5 (NSW), but not Fig 2 (NZ). Fig 4 (SA) used principle diagnosis, so a decrease in minor wounds to the head of cyclists admitted to hospital for other reasons may not be apparent.
For WA, Fig 3 shows data from 1971-95, classified by Hendrie, Legge, Rosman and Kirov, 1999 for cyclists, pedestrians and motor vehicle occupants. An alternative classification, only for cyclists, from 1981-95, based on principle diagnosis, was also published – see http://www.health.wa.gov.au/publications/pubhealth/app15.htm. Data for skull fractures and intracranial injuries were very highly correlated (r=0.98) with the cyclist data in Fig 3. A much better insight into the full picture is provided by Fig 3, because it also shows the same statistics for other road users.
References
Andersen, Schnohr, Schroll and Hein, 2000
Andersen LB, Schnohr P, Schroll M, Hein HO, 2000. All-cause mortality associated with physical activity during leisure time, work, sports, and cycling to work. Arch Intern Med 2000 Jun 12;160(11):1621-8.
Blacktown
Blacktown Bikeplan Study, Final Report. Blacktown City Council, Sydney.
Bloomfield, 2000
Bloomfield A, 2000. Cycling: your health, the public's health and the planet's health. Making Cycling Viable symposium .
Cameron, Newstead, Vulcan and Finch, 1994
Cameron M, Newstead S, Vulcan P, Finch C, 1994. Effects of the compulsory bicycle helmet wearing law in Victoria during its first three years. Monash University Accident Research Centre .
Cameron, Vulcan, Finch and Newstead, 1994
Cameron MH, Vulcan AP, Finch CF, Newstead SV, 1994. Mandatory bicycle helmet use following a decade of helmet promotion in Victoria, Australia - an evaluation. Accident Analysis & Prevention 1994;26(3):325-337.
Carr, Dyte and Cameron, 1995
Carr D, Dyte D, Cameron MH, 1995. Evaluation of the bicycle helmet wearing law in Victoria during its first four years. Monash University Accident Research Centre Report 76.
CPF, 2011
Riding a bike for transport - 2011 survey findings. Canberra: Cycling Promotion Fund. 2011. .
DiGuiseppi, Rivara, Koepsell and Polissar, 1989
DiGuiseppi CG, Rivara FP, Koepsell TD, Polissar L, 1989. Bicycle helmet use by children. Evaluation of a community-wide helmet campaign. J Amer Med Assoc 262:2256-61.
Gennarelli, Thibault and Ommaya, 1972
Gennarelli TA, Thibault LE, Ommaya AK, 1972. Pathophysiological responses to rotational and translational accelerations of the head. Society of Automotive Engineers Paper 720970.
Heathcote and Maisey, 1994
Heathcote B, Maisey G, 1994. Bicycle use and attitudes to the helmet wearing law. Traffic Board of Western Australia May 1994.
Hendrie, Legge, Rosman and Kirov, 1999
Hendrie D, Legge M, Rosman D, Kirov C, 1999. An Economic Evaluation of the Mandatory Bicycle Helmet Legislation in Western Australia. Road Accident Prevention Research Unit . 
Hillman, 1993
Hillman M, 1993. Cycle helmets: the case for and against. Policy Studies Institute ISBN 0-85374-602-8.
Jacobsen, 2003
Jacobsen PL, 2003. Safety in numbers: more walkers and bicyclists, safer walking and bicycling. Injury Prevention 2003;9:205-209.
Janssen and Wismans, 1985
Janssen EG, Wismans JSHM, 1985. Experimental and mathematical simulation of pedestrian-vehicle and cyclist-vehicle accidents. 10th International Tech Conference on Experimental Safety Vehicles Oxford July 1985.
Johns, 2011
Johns R, . Cost Benefit Analysis. How it works, and when it doesn’t work. . University of British Columbia, 2011. Includes consideration of helmet benefits..
Ker, 2011
Ker I, . Empty Cells, Damned Half-Truths and Pseudo-Statistics:The Lot(tery) of the Bicycle Planner. Paper presented at the the PATREC Planning and Transport Research Centre Forum, 13 September 2011.
Lawlor, Smith and Ebrahim, 2004
Lawlor DA, Smith GD, Ebrahim S, 2004. The hormone replacement - coronary heart disease conundrum: is this the death of observational epidemiology?. Int Journal of epidemiology 2004;33:464-467.
Marshall and White, 1994
Marshall J, White M, 1994. Evaluation of the compulsory helmet wearing legislation for bicyclists in South Australia. South Australia Dept of Transport Report 8/94.
McLaughlin, 2006
Wearing a helmet puts cyclists at risk, suggests research. 2006.
NHMRC, 1994
Football injuries of the head and neck. National Health & Medical Research Council, AGPS, Canberra .1994.
Petitti, 2004
Petitti D, 2004. Hormone replacement therapy and coronary heart disease: four lessons. Int Journal of Epidemiology 2004;33:461-463.
Phillips helmets
Phillips helmets. .
Phillips, Fyhri and Sagberg, 2011
Phillips RO, Fyhri A, Sagberg F, 2011. Risk compensation and bicycle helmets. Risk Analysis 2011; Mar 18.
Powles and Gifford, 1993
Powles JW, Gifford S, 1993. Health of nations: lessons from Victoria, Australia. BMJ 1993 Jan 9;306(6870):125-7.
PWC, 2009
Evaluation of the costs and benefits to the community of financial investment in cycling programs and projects in New South Wales.. Price Waterhouse Coopers, 2009.
Rissel and Wen, 2011
Rissel C, Wen LM, 2011. The possible effect on frequency of cycling if mandatory bicycle helmet legislation was repealed in Sydney, Australia: a cross sectional survey. Health Promotion Journal of Australia 2011; 22: 178-83.
Robinson, 1996
Robinson DL, 1996. Head injuries and bicycle helmet laws. Accident Analysis & Prevention 1996 Jul;28(4):463-75.
Robinson, 2001
Robinson DL, 2001. Changes in head injury with the New Zealand bicycle helmet law. Accident Analysis & Prevention 2001 Sep;33(5):687-91.
Robinson, 2005b
Robinson DL, 2005. Safety in numbers in Australia: more walkers and bicyclists, safer walking and bicycling. Health Promotion Journal of Australia 2005;16:47-51.
Taylor and Scuffham, 2002
Taylor M, Scuffham P, 2002. New Zealand bicycle helmet law - do the costs outweigh the benefits?. Injury Prevention 2002;8:317-320. 
Thompson, Rivara and Thompson, 1989
Thompson RS, Rivara FP, Thompson DC, 1989. A case control study of the effectiveness of bicycle safety helmets. New England Journal of Medicine 1989 v320 n21 p1361-7.
Thompson, Rivara and Thompson, 2002-9
Thompson DC, Rivara FP, Thompson RS., 2002. Helmets for preventing head and facial injuries in bicyclists (Cochrane Review). Cochrane Database Syst Rev issue 4, 2002.
Walker, 1996
Walker M, 1996. Bicycling in Sydney: law compliance and attitudes to road safety. Velo Australis .
Walker, 2007
Walker I, 2007. Drivers overtaking bicyclists: Objective data on the effects of riding position, helmet use, vehicle type and apparent gender. Accident Analysis & Prevention 2007 Mar;39(2):417-25.
Webber, 1992
Webber R, 1992. Cycling in Europe. Ausbike 1992 proceedings, Bicycle Fed of Australia .